
The first was the DJIA breaking out to new highs. As I mentioned several weeks ago the lagging behavior of the DJIA with the NDX already topping is like a Sirens Song meant to lure the public into the top since the public looks mainly at the DJIA. A continued rally at this point would probably mean a larger degree correction later.
The second was that the TNX broke above 3.0% in the face of strong bearish sentiment which may indicate the the Smart Money is bearish on bonds. The last time this happened was at the end of 2017 and the result was a large move by bond investors into stocks at the Jan top. An Apr-May rise in rates was due to Russia's selling of US bonds in response to Trumps sactions, perhaps China with 10x the amount of US bonds will follow the Russian example. If so, the result could be a push in the TNX towards 4.0% that may cause a short term rush into equities by bond holders, but for the longer term could spell disaster for the faltering housing market and force the Fed to pursue a more aggressive longer term stance. The Fed does not usually quit until the yield curve inverts which could extend the tightening cycle into mid-2020 to 4.5% funds rate.
Finally, significant bearish sentiment never appeared and the VIX Call Indicator 10 day SMA which signaled the Jan 2018 top and the Sept 2014 top only rose by +36% of the avg to just above the mean.
I. Sentiment Indicators
The overall Indicator Scoreboard (INT term, outlook two to four months) has now dropped down to the level comparable to the SPX 50 pt pullback in mid-Aug, but I want to point out the much lower levels in mid-Dec 2017 that resulted only in a two week consolidation when TNX rates were rising strongly.

The INT view of the Short Term Indicator (VXX $ volume and Smart Beta P/C, outlook two to four months) is in the strong warning area, but again similar to mid-Dec 2017.

Bond sentiment (TNX) fell sharply at the end of the week in the face of a spike in earlier bearish sentiment. As mentioned in the introduction, we saw something similar in mid-Dec 2017 that was a prelude to a sharp rise in rates that could be positioning by smart money. Two factors that may be pressuring rates higher are the unexpectedly strong deficits (growth is not increasing tax revenues) and possible selling by China.

For the INT outlook with LT still negative, the gold miners (HUI) bearish sentiment has also declined sharply with the recent rally roughly being the 10-15% I was looking for. Not too long ago I saw a chart that showed the Chinese as the largest public holders of gold and the slowdown in their economy is not a positive for gold.

II. Dumb Money/Smart Money Indicators
The Risk Aversion/Risk Preference Indicator (SPX 2x ETF sentiment/NDX ETF sentiment, outlook 2 to 4 days/hours) as a very ST indicator is starting to improve relative to its TL as the recent weakness in techs has removed some of the frothiness from the NDX sentiment relative to the SPX. Conclusion, NDX more likely to consolidate than selloff.

The option-based Dumb Money/Smart Money Indicator as short/INT term (outlook 2 to 4 days/weeks) saw a sharp reversal from the near SELL levels early in the week and is likely to reach a BUY with a 1-2% pullback. Notice the much lower levels seen last Dec and Jan before a bigger top.

The INT term SPX Long Term/Short Term ETFs (outlook two to four weeks) bearish sentiment has moved back to neutral and is also in a similar position as seen in mid-Dec 2017.

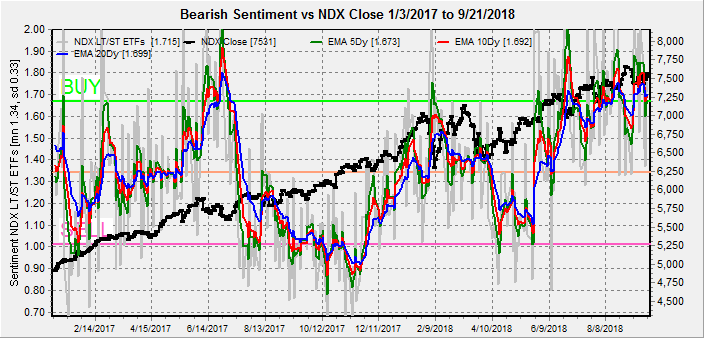
Long term neutral, the INT term NDX Long Term/Short Term ETF Indicator (outlook two to four weeks) with a closeup of the Jun-Sep period below showing that very short term is more indicative of a consolidation until sentiment breaks either way.

III. Options Open Interest / Other
Using Thurs close, remember that further out time frames are more likely to change over time. This week I will look out thru Sept 28. Fridays bearish outlook may have increased put support.
With Fri close at SPX 2930, the SPX is at the top of put support with 2900-30 largely overlapped providing little resistance either way, but a slight downward bias. Light open int overall.

Wed is somewhat similar with the most likely range SPX 2900-25.

Fri shows larger open int with strong call resistance starting at SPX 2925, and the very strong put support at 2850. Support at 2900 is likely to increase with any early pullback so may hold for the weeks low.

Conclusions. The overall Indicator Scoreboard indicates that some type of short term pullback is likely, but overall sentiment indicated that a pullback of 1-2% or a two week consolidation may be all. It may be my imagination but I am getting the feeling that the next surprise may be a breakdown in bonds (higher TNX rates) that could push more bondholders out of bonds and into stocks. There has always be a widely held belief that stocks run into trouble when the index dividend rate hits 50% of the TNX rate. With the SPX div rate at 1.7%, this is at TNX 3.4%. This happened in the summer of 1987.
Weekly Trade Alert. Mon pre-market is likely to selloff due to China trade talk breakdown but with limited downside. Updates @mrktsignals.
Investment Diary, Indicator Primer, update 2018.03.28 Dumb Money/Smart Money Indicators
Article Index 2018 by Topic
Article Index 2017 by Topic
Article Index 2016 by Topic
Long term forecasts
© 2018 SentimentSignals.blogspot.com
Arthur,
ReplyDeleteIt sounds like you think we got one more good wave up coming before a very large drop (a 5th wave of some lessor degree to end a long bull market run... like Tony Caldaro's Jan. 2016 to now Major wave 1 big wave up). Is that about correct?
I believe the 1987 crash was some large degree wave 2 down or something as it started a 10+ year bull run up that Clinton took credit for. Now Trump is going to get blamed for the crash... and it's looks to be coming soon, maybe before this year ends? I'm sure he'd like to keep the market up until after the midterms, and maybe he succeeds, but 2019 is looking very ugly right now.
If you are right about the TNX rates and bond selling then I don't see how that will last more then a few month before it all comes to head and tops out the DOW, SPX, etc... which leaves us with another 1987 drop to worry about.
From a political point of view if Trump can't keep the market going up into 2020 for him to get re-elected for a second term then letting it crash after the midterms would give him 2 years to work on restoring confident back into his presidency to "possibly" get a second term. But if it were to crash in 2020 he's never get re-elected.