
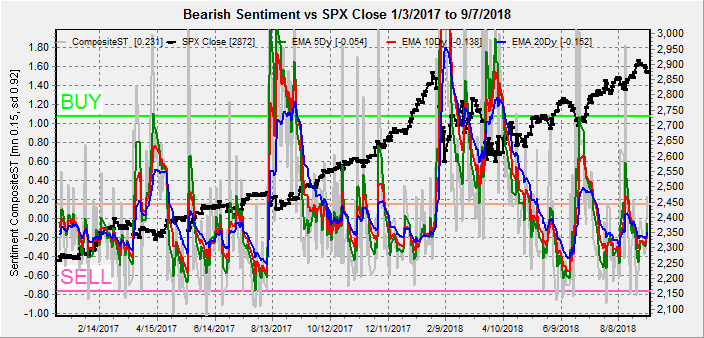
I. Sentiment Indicators
The overall Indicator Scoreboard (INT term, outlook two to four months) was accurate with a SELL at the Aug top, and shows some improvement with last weeks action, but not enough to expect an immediate rally.

The INT view of the Short Term Indicator (VXX $ volume and Smart Beta P/C, outlook two to four months) was little changed, again not supportive of much of a rally.
Bond sentiment (TNX) surprisingly showed a sharp drop in bearishness even as rates rose with the strong wage growth in the jobs numbers. Bond investors seem to be discounting inflationary implications due to trade war concerns.

Looking at the LT, I have been negative on the gold miners (HUI) for most of the last two years while many have been talking about a new bull market and even with a decline of almost 50% from 2016, bearish sentiment is more indicative of the early stages of a decline. Comparing this time to the 2015 decline, sentiment in 2015 had already reached a BUY before the last collapse from 180 to 100. so this decline may have more to go than people imagine.

II. Dumb Money/Smart Money Indicators
The Risk Aversion/Risk Preference Indicator (SPX 2x ETF sentiment/NDX ETF sentiment, outlook 2 to 4 days/hours) as a very ST indicator remains near the bottom of its TL with little change for investors appetite preferring NDX to SPX, not a good sign given the recent weakness in NDX.

The option-based Dumb Money/Smart Money Indicator as short/INT term (outlook 2 to 4 days/weeks) has started to rise and may reach a buy by the end of week.

The INT term SPX Long Term/Short Term ETFs (outlook two to four weeks) bearish sentiment continues to be one the most accurate indicators reaching a SELL at the Aug top, and last weeks lack of improvement is indicative of stronger downside ahead, the only question is whether there will a be a brief options related rally first.

Long term neutral, the INT term NDX Long Term/Short Term ETF Indicator (outlook two to four weeks) has reached the level where a short term rally occurred in the past couple of months, but the overall high levels have marked longer term tops.

III. Options Open Interest / Other
Using Thurs close, remember that further out time frames are more likely to change over time. Given last Fri downward volatility, put support is likely stronger for the week than shown on Thur.
With Fri close at SPX 2772, Mon has some put support up to 2875 with offsetting puts and calls from 2880 to 2895. Light open int overall with a slight upward bias.

Wed is somewhat similar but with put support moving down to SPX 2860, while there is some call resistance at 2880 but little at higher prices.

Fri shows larger open int with significant call resistance starting at SPX 2900, and the 2850 up to 2880 show a lot of overlap. Some volatility between 2850-80 seems likely.

Conclusions. Next week is likely to show some downward pressure, but may find support between SPX 2850-60. Currently sentiment is not showing much support for a rally.
Weekly Trade Alert. None. Outlook may change by end of week. Updates @mrktsignals.
Investment Diary, Indicator Primer, update 2018.03.28 Dumb Money/Smart Money Indicators
Article Index 2018 by Topic
Article Index 2017 by Topic
Article Index 2016 by Topic
Long term forecasts
© 2018 SentimentSignals.blogspot.com
No comments:
Post a Comment