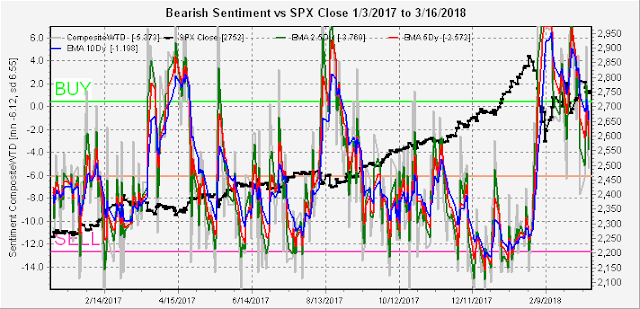
Last week met our upside target of SPX 2800+ and started a pullback that could extend into the end of March. Normal sentiment measures continue to unwind, but at a slow pace. SPX options open interest is showing promise compared to using SPY and this week I will take an extended look out to the May expiration.
I. Sentiment Indicators
Again shorter time frames and EMAs. The overall Indicator Scoreboard has bounced back from the lower levels seen last week and earlier this week, making a full retest of the lows any time soon less likely.
The Short Term Indicator (VXX $ volume and Smart Beta P/C) is hovering around the mean at a lower level than the previous pullback to SPX 2650, so some additional decline is possible.
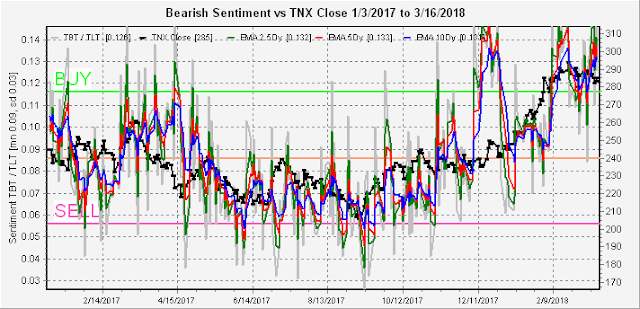
Bearish bond sentiment (TNX) saw a significant uptick last even as rates declined slightly, meaning that more consolidation or some pullback is likely for the next few weeks. This should provide some relief from interest rate pressure for stocks and gold miners.
The gold miners (HUI) bearish sentiment has now risen to the levels seen in early Feb when the GDX rallied from 23 to 25 so a rally to HUI 185 might be expected. A closer look at GDX is shown in the options section.
II. Options Open Interest
First, I want to take a look at Friday's SPX open interest. Last weeks chart showed little put support until 2730, but early in the week additional support rose from new puts at 2750 and I posted on Twitter that a close below 2750 was unlikely and could reach 2770. Later by Fri AM more calls were added around the 2760 area making the most likely close 2750-55 (actual 2752). The SPX options seem to change more than the SPY, so I will probably start posting AM updates of the MWF expirations, at least when there are posted trading opportunities. Link to CBOE SPX Weekly (PM) options info here.
Mon SPX option setup looks much like Fri with a slight upside bias to a close at 2760, but put support is weak below 2745 with 2710 possible on a strong breakdown.
For FOMC Wed we have an odd setup I'm calling the twin towers. Given the usual volatility aroud FOMC day we could see some wild swings Tue/Wed from a low of 2730 to a high of 2785, but the most likely close is 2765. Due to the weakness possible after Wed, SPX 2780-85 is a shorting oppty.
For Fri, there is much larger call resistance than put support above 2740 and the most likely close is 2730-40.
For Mar 29 EOQ, the huge open int compared to other weeklies may be pressuring the market downward, but the most likely close is 2725. Lower levels are possible intra week with strongest support at 2650, 2680, then 2700-10.
Looking farther out for Apr and May a trading range of 2700-2800 seems probable with Apr's most likely close a 2760 and May's at 2765 with more downside a possibility for May.
Finally, a look at GDX where unfortunately the last close at 21.50 is also the most likely close for Apr 20 with strong support at 21 and fairly strong resistance up to 24.
Conclusions. More downside seems likely from last weeks high of SPX 2802, but the overall Indicator Scoreboard says it may be limited. SPX options indicate a possible top around 2780 by Wed that may be the b-wave of an abc correction of lengths -60,+40,-60 with the correction extending into the last week of the month around 2720. More downside is possible, but not probable at this point. April and May look to be consolidation months between SPX 2700-800 to allow bearish sentiment to subside before possible summer fireworks.
Weekly Trade Alert. A pullback did start from the targeted area of SPX 2800-20 last week, but the hoped for VIX Call SELL did not appear and the downside seems limited at this point. Next week could see the next leg down starting FOMC Wed with an upside target of SPX 2780+ to short and a downside target of 2720-30. Updates @mrktsignals.
Investment Diary,
Indicator Primer,
update 2018.02.23
ETF Sentiment Revision
Article Index 2018 by Topic
Article Index 2017 by Topic
Article Index 2016 by Topic
Long term forecasts
© 2018 SentimentSignals.blogspot.com


No comments:
Post a Comment