
I. Sentiment Indicators
The overall Indicator Scoreboard (12.5, 25, 50 day EMAs) shows a sharp rise in bearish sentiment with the 12.5 day reaching the BUY, but the longer term 50 day only neutral. There is no evidence of a new bull market phase.

The Short Term Indicator (VXX $ volume and Smart Beta P/C) has reached the 2015 flash crash levels for the two shorter term EMAs, but the longer term has started to roll over. Given the huge jump in volatility with the two days of DJIA 1,000 pt drops the previous week, the change in sentiment is much more in line with expectations than the huge run up in Aug 2016 with only a 2% drop in stock prices.

Looking at the Short Term Indicator with short term EMAs (2.5, 5, 10 days), sentiment has now dropped to a similar level as the V bounce from the Aug 2015 flash crash before a retest occurred. So this suggests that a retest of the lows may occur over the next few weeks.

Bearish bond sentiment (TNX) has continued to rise (6-12 month outlook) so it's possible that interest rates may not rise much further. This would probably be consistent with the stagflation outlook with weak growth, but higher inflation.

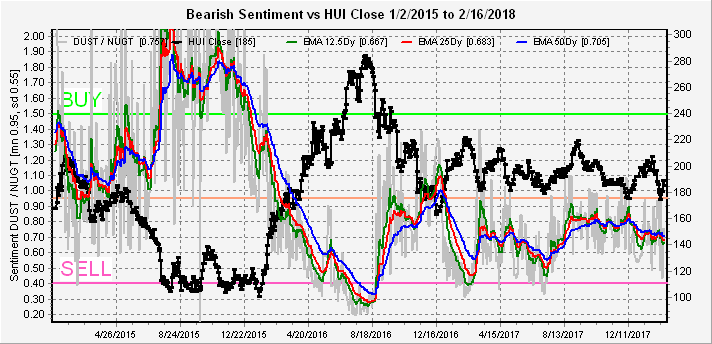
The gold miners (HUI) bearish sentiment (6-12 month outlook) continues to fade as the miners appear to be stuck in quicksand with nowhere to go.
II. Options Open Interest
Back again. This week I will take a look at next weeks SPY (close 273.1, SPX 2732) for Wed and Fri and the March monthlies for SPY, GDX and VIX. For the SPY on Wed, call resistance starts at 270 with little put support until 260. At 273, delta hedging could push up to resistance at 275, but below 270 prices could fall dramatically.

For Fri, strong put support could push prices up to first resistance at 272 or higher.

For SPY March monthlies, the "most likely" is 272-3, but a move below 270 could fall to 265.

For GDX (close 22.5), put support is likely to keep prices above 22. but upside is limited to about 24. "Most likely is 23, but a move below 22 could go to 21. Limited upside with more downside risk.

For the VIX (close 19.5) for Mar 21, there is significant put support at 15 and call resistance above 21. If VIX call buyers are "smart money" a trip to 21 or 25 seems likely before expiration.

III. Technical Indicators
So far so good with the 1994 analog shown last week. Below is a 3 month chart from mid Jan to mid Apr 1994. We should be at the day before the 475.1 high. The last 3 day holiday was MLK day with the public "FOMOing" at the mouth after a record run up in stock prices the previous week. The result was a strong "pop and drop" and hopefully we see the same next Tues.

The following is an updated table hopefully with an easier to follow timeline. I did notice that I missed the 475.1 top using the prior days high and that was corrected. The result was a higher projected 2nd Feb high of 2736 and since the SPX prior high of 2727 was 22 pts higher than 2018 proj, the revised projected high would be 2758. I penciled in the Fri high at 2754 just in case, but hopefully Tues AM will show a new high. Next could be a two day drop down to about SPX 2600, then a rally back of about 110 pts. Oddly, this is about the same as the potential shown by the options open int for next week.

Looking forward to the lower early March low, I expect this to be around the next jobs report which was Feb 2 for Jan jobs, but the BLS is reporting that Feb jobs will be out Mar 9 so some timing differences are expected to start appearing. Remember Feb 2's SPX 50 pt drop was followed by by Black Mon/Tue's additional 180 pt drop, so people are likely to be very antsy next time.
Conclusions. Stock sentiment indicators are not pointing to the immediate resumption of the bull market, and the short term ST Indicator is showing that a retest of the lows is likely soon. Both options open int and the 1994 analog (warning, these always fail sooner or later) point to a potential sharp drop early next week to as low as SPX 2600 before an end of week rally back over 2700, so we could have an exciting week. The outlook beyond the next couple weeks is muddled by the outlook for interest rates. Both 1994 and 1999 saw a sharp rise in interest rates and fall in stock prices the last half of Feb, likely from the economic pickup from warmer weather, and the main difference was that in 1994 rates continued to rise sharply thru mid year, unlike 1999. Bond sentiment may be showing that the rise in rates could slow which would be more bullish for stocks than 1994.
Weekly Trade Alert. Last weeks upside target was met, but no lower price entry presented itself. Next week should be easier unless we gap down Tues AM. Look for short on SPX 2750-60, hopefully new high over 2754 with stop at 2770. Target low 2600s, then long for 2700+ target on bounce. Updates @mrktsignals.
Investment Diary, update 2017.10.28, Indicator Primer
Article Index 2018 by Topic
Article Index 2017 by Topic
Article Index 2016 by Topic
Long term forecasts
© 2018 SentimentSignals.blogspot.com
No comments:
Post a Comment