
Last Sunday I googled "bond market crash" and came up with 1994, and in the technical indicator section will take a close look at what happened to stocks and interest rates then and how now may not be like 1987, but not much better.
I. Sentiment Indicators
The overall Indicator Scoreboard saw a large jump in bearish sentiment, but the lagging 20 day EMA is only at the 0.0 level matching early levels of the 2015 flash crash and Jan 2016 selloff. Rebounds, more volatility and retest of the lows seem most likely.
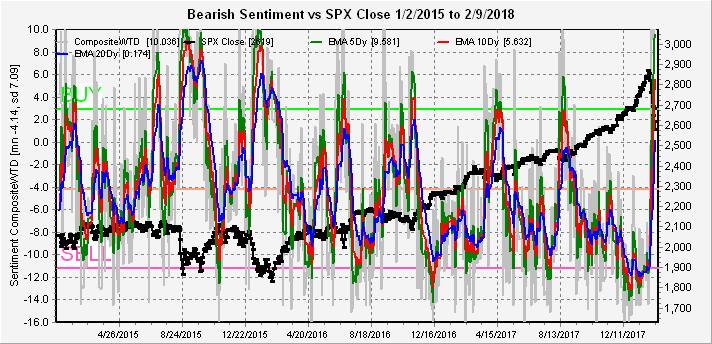
The Short Term Indicator (VXX $ volume and Smart Beta P/C) moved to levels higher than any time over the last three years. As we saw in Aug, in time of strong liquidity support, this can result in stock melt ups, but the longer term outlooks below are not immediately supportive. VIX $ Volume is more extreme suggesting volatility compression is likely.

Bond sentiment (TNX) shows increased levels of bearishness that could lead to a consolidation with modest support for stocks, but not at levels to support a turn around in rates.

The gold miners (HUI) sentiment has barely moved even though prices are testing their 12-month lows. This supports the options OI results for GDX from a couple of weeks ago that showed resistance at 25 (tagged) and support at 23 but not much to stop a strong move if either was breached (Fri was below 21).

II. Long Term Sentiment Indicators (5X, 25, 50 & 100 day EMA)
The long term overall Indicator Scoreboard shows a clear long term down trend in bearish sentiment since the flash crash of Aug 2015 with a SELL being generated at the Jan top. The indications are that this is likely a multi-year top in stocks, ie, start of a bear market.
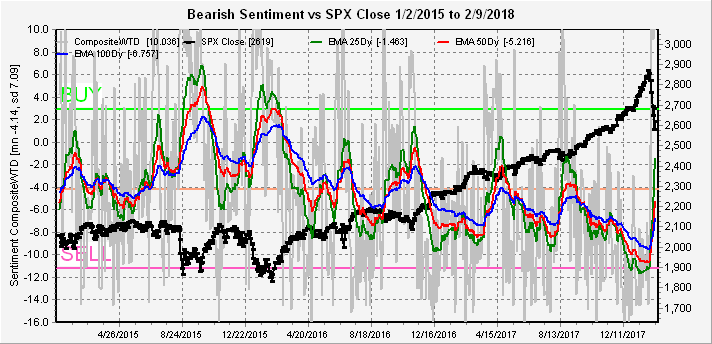
The Short Term Indicator (VXX $ volume and Smart Beta P/C) is similar but somewhat more supportive with the 100 EMA reaching the BUY level. This could be simply the same as the early 2015 flash crash era so that a multi month consolidation occurs.

The long term CPC (combined put/call ratio) revised (less VIX puts & calls) mirrors the Indicator Scoreboard, indicating probable bounce but no bull market continuation.

III. Technical Indicators
Again, no options OI this week. So let's start with the "bond crash" of 1994. I am not sure why this is called a crash as there have been other sharp rises since, but it did mark the peak in rates for the next 25 years as the TNX rose from 5.15% late 1993 to 8.16% late 1994 most in the first half of the year. The equivalent today would be a rise from 2.5% to 4.0%.

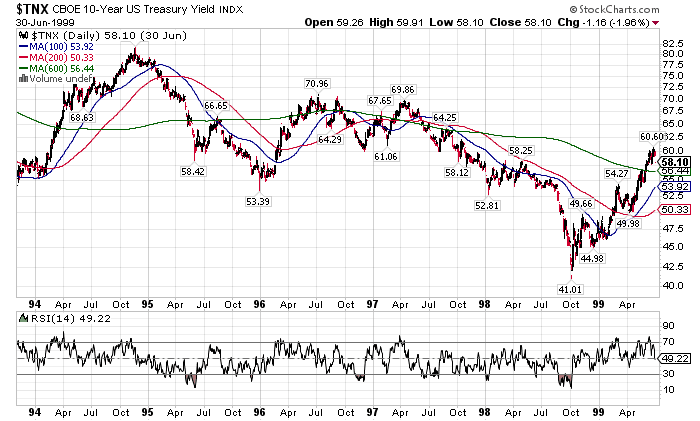
What I found most interesting was the performance of the stock market during this period. The 1994 period followed almost textbook TA, unlike 2018. Here goes, strong rally into end of Jan, strong selloff first week of Feb (A), wedge or expanding triangle with lower lows and retest trendline (B), breakdown with H&S with less volatility (C > A), sharp rally as ED after 200 day SMA broken (D), crash (twice A or C) to 600 day SMA (E).

For reference to why the 600 day SMA might be important, look at 2015-2018. Aug 2015, flash crash went solidly thru it and today it stands at SPX 2268. Are we headed to the SPX 2200 level?

To put some numbers to the charts, I downloaded some historical data from Yahoo finance and put into Excel. Here, I used the ratio of the January advances as a multiple and assumed that A and C are combined since we already tested the SPX 200 day SMA. The result projects to a low of SPX 2599 which is close to the first low, but higher than last weeks low of 2533. This scenario would probably have 6 weeks or so of consolidation before a final low of SPX 2365.

In the second scenario, which I call the "doomsday scenario", I use 165% of the ratio of the Jan advances. I know this sounds far fetched, but the timing patterns for Feb (wedge) indicate a higher high next week (SPX 2740-50ish), followed by a decline the next week then a lower high for a H&S (SPX 2720ish), then another late month selloff to SPX mid-2400s, So next couple of weeks should see how this works. Then, of course, the late March crash. I saw where one EW analyst made the same prediction for Feb using a "triple zig-zag", not an EW expert so can't comment.

Conclusions. This week I am focusing on the more bearish possible outcome due to the weakness in pullbacks in interest rates. 1999 saw a 50% retracement in TNX rates as stocks fell, but in 2018 rates rose from 2.5% to 2.9% and have only fallen to 2.82% with stocks down 10%. The result is much more like 1994 and indicate that the SPX could fall to the 2200 level if rates rise to 3.5% or higher. This would put the SPX back to the pre-election period and wipe out Trump's rally. My conclusion is that the lower levels are unlikely due to the preponderance of EW analysts looking for SPX 2400 as a W4 bottom, increasing the likelihood of a stronger than expected rally (2750) before a possible 600 pt crash.
Last week I mentioned that there may be more to the end of month selloff related to QE unwinding and this week Tom McClellan states that in Jan, the Fed doubled its sales to $20 billion and dumped it all at the EOM. Will the same the happen for a couple more months before the Fed switches tactics - perhaps selling at a discount to dealers or financial institutions? How will this effect stocks?
Weekly Trade Alert. Finally, we have some clarity to the market potentials. One thing that keeps me hesitant about a direct rally to SPX 2750 is that my experience shows that support (200 day SMA) often occurs with the DJIA due to wider recognition by the public. It is possible that Mon/Tue sees lower lows before a "turnaround". Long SPX if DJIA test 200 day SMA (22,800), target SPX 2720+. Updates @mrktsignals.
Investment Diary, update 2017.10.28, Indicator Primer
Article Index 2017 by Topic, sorry, falling behind, will catch up soon
Article Index 2016 by Topic
© 2018 SentimentSignals.blogspot.com
Thanks Arthur
ReplyDelete