
I. Sentiment Indicators
The overall Indicator Scoreboard (outlook two to four months) declined sharply during the week closing near the lows, similar to the levels at the Mar top. It's very possible that sentiment stays above the mean for a while to balance the five months spent below the mean at the end of 2017. Does this mean a possible trading range of SPX 2550-2750 to the summer?

The Short Term Indicator (VXX $ volume and Smart Beta P/C, outlook two to four weeks) has also fallen to levels similar to recent tops, so we are likely starting a moderate correction to the mid-low SPX 2600s thru the end of Apr/early May.
Bearish bond sentiment (TNX) remains very high, but may be repeating a mirror image of Q3.2017 when rates fell even though sentiment was very low, before finally reversing.

The gold miners (HUI) bearish sentiment jumped sharply as rates rose last week, but three of the last four times sentiment was this high, the HUI jumped 10 to 15 pts over a short period of time.

The regular Dumb Money/Smart Money Indicator was stuck below neutral last week, but the Risk Aversion/Risk Preference Indicator captured most of last weeks price swings, so I want to look at this indicator in more detail.
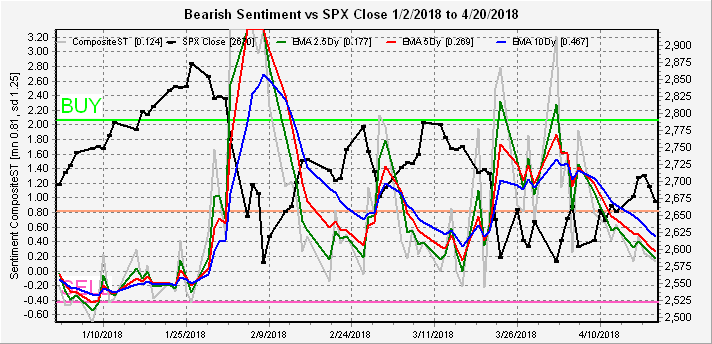
The INT term SPX Long Term/Short Term ETFs (outlook two to four months) is little changed, remaining slightly below neutral.

The INT NDX Long Term/Short Term ETF Indicator (outlook two to four months) fell to the level of the late June 2017 top and met with an immediate selloff. Even though the price decline was roughly equal to the early Aug 2017 decline the change in sentiment was subdued, indicating lower prices are likely eventually.

The Dumb Money/Smart Money Indicator (outlook 2 to 4 days/hours) showed slight negative leanings at the close on Tues and Thurs, but no SELL indications.
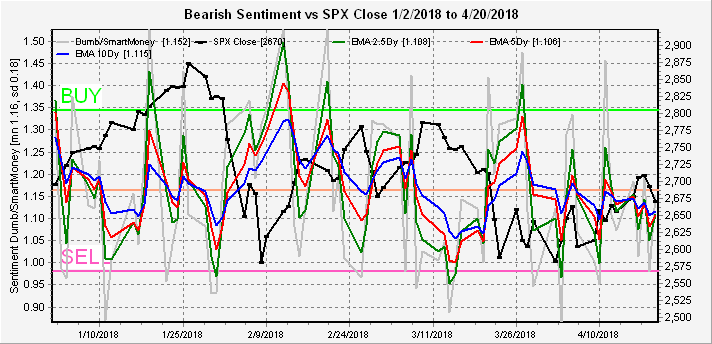
The DM/SM cyclical component (outlook 2 to 4 days/hours) did fall sharply last week, however, but remains above the levels of previous tops this year.

The Risk Aversion/Risk Preference Indicator (SPX 2x ETF sentiment/NDX ETF sentiment, outlook 2 to 4 days/hours) closed last Fri below neutral but an hour after the Mon open was showing a weak BUY (at SPX 2678) that strengthened during the day, Wed saw a sharp drop to below neutral, was flat for Thur, then moved to a SELL Fri an hour after the open. I expect a bounce early next week, so do not treat this as a SELL for Mon.

Last week, I checked the reading each day an hour after the open, at mid-day and an hour before the close. Hopefully in a couple of weeks I can begin posting on Twitter. Here's what the indicator showed an hour after the open Mon at SPX 2678 that reached 2717 by Wed.

Here's what the indicator showed Wed an hour after the open at SPX 2710.

And on Fri, this time I forgot to look until 1.5 hours after the open at SPX 2679 before the drop to 2660. Next week I am going to try at 0.5 hours after the open to see how reliable that may be.

III. Options Open Interest
Last week I forgot to include the "or sooner" in my outlook as the SPX 2700+ area was captured much sooner than expected and almost made a round trip by Fri. Sometimes I feel that the "algos" are front running my trades. This week there is a lot of overlap by puts and calls so support/resistance may not hold, also Fri 27th and Mon 30th have very large (3-4x) regular open int size so are likely to dominate.
Mon 23rd, there is strong support at SPX 2625 and resistance at 2680, but over 2680 puts at 2700 and 2710 may act as magnets. Likely range is 2650-80.

Mon 23rd, there is strong support at SPX 2625 and resistance at 2680, but over 2680 puts at 2700 and 2710 may act as magnets. Likely range is 2650-80.
For Wed 25th, there is so much overlap between SPX 2650 and 2700 that it's hard to even guess.

For Fri 27th, we have very large open int size and most of the puts are SPX 2675 and lower, while most of the calls are 2690 and higher, so sometime during the week we should see 2680-85 which is the expected close Fri.

For Mon 30th, again a very large open int day, calls overlap puts all the way down to SPX 2650, so we could see a sizable drop all the way to 2640 with an expected close from 2660-70.
Conclusions. The interest rate outlook is changing so rapidly that is hard to keep up, but the surge in the TNX to 2.95% increases the likelihood that a move over 3.0% will occur sooner. The recent drop in INT term sentiment to neutral will likely continue into June if the SPX continues to trade between 2650 and 2750 which can provide the recipe for another 10-12% drop down to the SPX 2400s. One possible scenario is a bounce next week to SPX 2685ish, then drop to 2640-50, which may be followed by a final rally into mid, late May to 2740-50.
Weekly Trade Alert. None this week. Potential for a short from SPX 2680-5. Long oppty likely next week. Updates @mrktsignals.
Investment Diary, Indicator Primer, update 2018.03.28 Dumb Money/Smart Money Indicators
Article Index 2018 by Topic
Article Index 2017 by Topic
Article Index 2016 by Topic
Long term forecasts
© 2018 SentimentSignals.blogspot.com
No comments:
Post a Comment