I. Sentiment Indicators
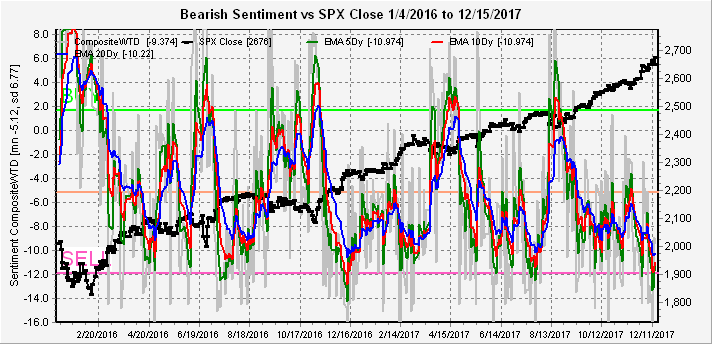
The overall Indicator Scoreboard rose moderately from extremely low levels, but remain nowhere near supportive of higher prices.

The Short Term Indicator (VXX $ volume and Smart Beta P/C) also bounced, but has still not reached the levels of significant tops, so a continued decline is more likely to be a buying opportunity.

The SPX related ETFs are more ominous with the longer term SDS/SSO at levels where moderate pullbacks were seen over the last 6-8 months and much more extreme than before the 2015 corrections. SPXU/UPRO ratios are comparable.

Even the NDX bearish sentiment fell sharply last week prior to Friday, reaching the lowest levels since July, but I am still expecting a low comparable to Nov 2015 before a large pullback.

Bond sentiment (TNX) fell sharply as interest rates pulled back sharply toward the 2.4% level. Combined with weakness in the dollar, global investors seem to believe that the GOP tax cuts are nothing more than a transfer of funds from the middle class to corporations and will do little to stimulate growth or inflation.

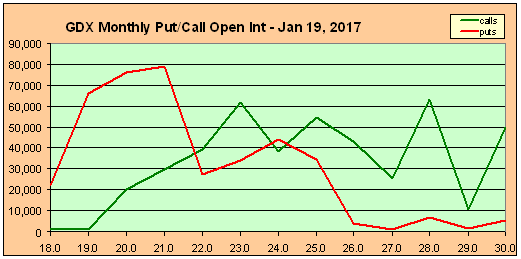
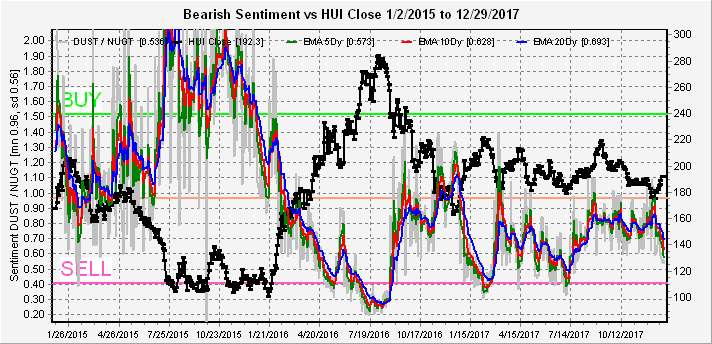
The reaction of the gold miners (HUI) was very muted, even as gold rallied strongly with weakness in the dollar and supported the view that tax cuts will not be inflationary. The sharp drop in bearish sentiment is, however, likely to limit upside in prices.
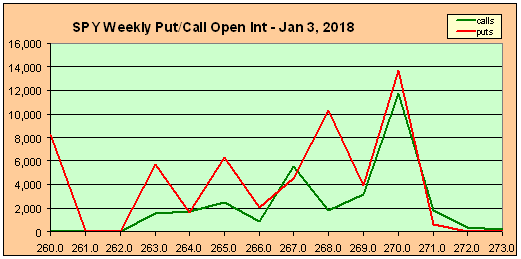
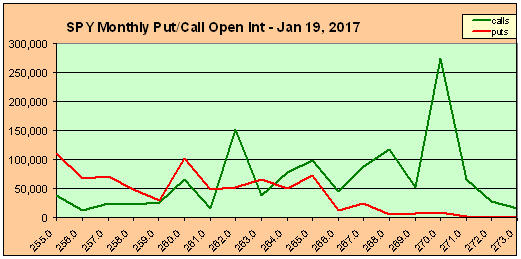
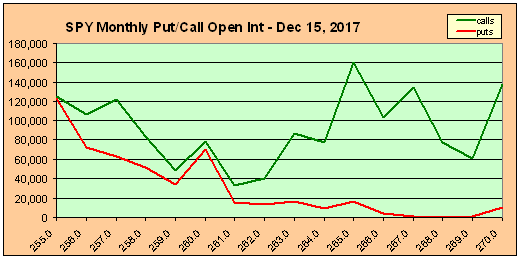
II. Options Open Interest
I'm only going to look at the Wed/Fri pair this week. For Wed, compared to last week about 35k of "new calls" were added late in the week. Typically, this represents "smart money" and means the SPY should reach 270 by Wed, but last Fri close at 266.9 makes it less likely.

For Fri, the "most likely" here is SPY 266 which is just below current levels with good put support at 265. A move back over 267 would begin delta hedging and support higher prices.

III Others
One other indicator that is more bearish is the VIX Call Indicator which rose by 55% of the mean in mid-Dec matching the levels seen in late Feb and early June of 2017. This does seem to be less effective if not confirmed by the ST Indicator.

Conclusions. The late week selloff has tempered my short term upside outlook, but I have noticed several times in the past that pullbacks that exceed well recognized support zones (SPX 2670, Avi Gilbert) in panic mode will often reverse. In the case of a move back toward the SPX 2700 area that would be a SELL short term. Overall sentiment says the market is at or near an INT top, but ST indicators say not quite yet.
Weekly Trade Alert. My long from SPX 2680 was stopped out via post on Twitter at BE. Outlook for next week is fairly uncertain, but a pop next week to SPX 2700+ thru Wed is a SELL with a target of 2660 (SPY 265+). Updates @mrktsignals.
Investment Diary, update 2017.10.28, Indicator Primer
Article Index 2017 by Topic
Article Index 2016 by Topic
© 2017 SentimentSignals.blogspot.com