I. Sentiment Indicators
The overall Indicator Scoreboard (INT term, outlook two to four months) similar to Aug 2017 bearish sentiment reached the SELL level a couple weeks before the SPX price downturn and was trending up before.

The INT view of the Short Term Indicator (VXX $ volume and Smart Beta P/C, outlook two to four months) was also declining sharply for the two weeks before the Aug 2017 volatility with the current sentiment lows the same.

Bond sentiment (TNX) is hovering near neutral so there is no sentiment bias for a directional move. The somewhat hawkish Fed outlook at the recent FOMC meeting may have caused a pause in higher rates, but any signs of continued economic strength are likely to lead to higher rates while a slowdown may cause rates to fall.

For the INT outlook with LT still negative, the gold miners (HUI) bearish sentiment is again nearing the SELL level. Without the dollar weakness seen in mid-2017, a sustained rally is unlikely.

II. Dumb Money/Smart Money Indicators
The Risk Aversion/Risk Preference Indicator (SPX 2x ETF sentiment/NDX ETF sentiment, outlook 2 to 4 days/hours) as a ST/INT indicator remains near the bottom of its TL. The TL lows match the mid-2017 lows, reversing the strong uptrend in sentiment thru the Jan highs.

The option-based Dumb Money/Smart Money Indicator as short/INT term (outlook 2 to 4 days/weeks) has moved off its recent sentiment lows and may be moving up to a larger BUY as seen after the Aug 2017 decline.

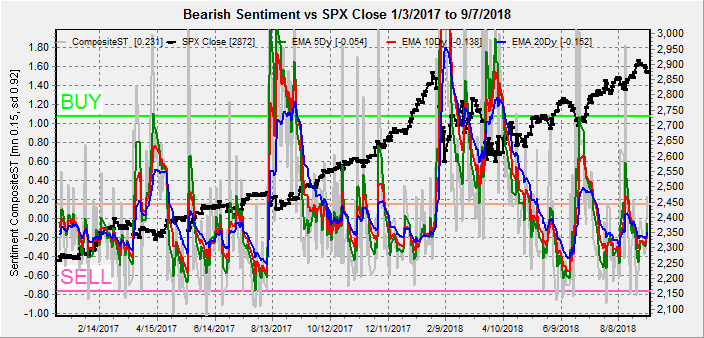
The INT term SPX Long Term/Short Term ETFs (outlook two to four weeks) bearish sentiment is near a SELL similar to right before the beginning of the Aug 2017 decline.

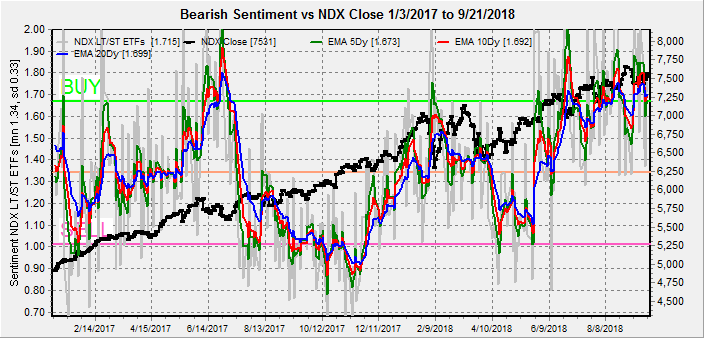
Long term neutral, the INT term NDX Long Term/Short Term ETF Indicator (outlook two to four weeks) has declined to about the same level as the last 4% decline in early Sept. Since May the NDX pullbacks have been limited by the 50 SMA (7464), a break of that level may be an early indication of bigger problems.

III. Options Open Interest / Other
Using Thurs close, remember that further out time frames are more likely to change over time. This week I will look out thru Oct 12.
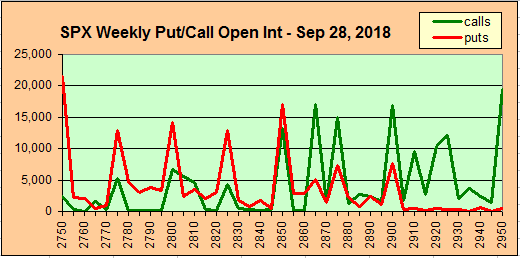
With Fri close at SPX 2914, Mon put support up to 2925 (likely stronger with Fri) is likely to push the SPX to 2925-35 or higher. Possible double top to Sept opt exp 2940 for Mon/Tue. Light open int overall.

Wed is somewhat similar except that strong resistance appears at SPX 2950, but down to 2875 shows only moderate support so a downward reversal is likely.

Fri shows larger open int with significant call resistance starting at SPX 2625 with strong support at 2900. A move down to at least 2920 seems likely.

For the following Fri, another large open int, there is significant call resistance at SPX 2905 and higher with the potential for a push down to 2880. The next Fri, opt exp, shows strong support at 2900, so this is should be at least a temporary bottom, depending on sentiment

Conclusions. Most of the sentiment is consistent with some type of pullback over the next two weeks following a retest of recent highs early in the week. The low volume of VIX calls does not indicate a large pickup in volatility. Options open int indicate that by Fri Oct 12 the SPX could reach the 2880 level or slightly lower, while the following week shows a move back over 2900 is expected. The increase in bearish sentiment will be an important indicator of what happens next. After the Aug 2017 pullback, I first pointed that the high sentiment was a warning of a possible melt up and it was.
Weekly Trade Alert. Ideally the SPX will test the Sept 21 highs of 2940 by mid-day Tue and begin an orderly pullback for the next two weeks, but with the Trump tweets anything can happen. A more volatile decline is more likely to lead to a stronger rally after, while an orderly pullback could lead to a Nov-Dec 2015 type top. Updates @mrktsignals.
Investment Diary, Indicator Primer, update 2018.03.28 Dumb Money/Smart Money Indicators
Article Index 2018 by Topic
Article Index 2017 by Topic
Article Index 2016 by Topic
Long term forecasts
© 2018 SentimentSignals.blogspot.com