Saturday, April 28, 2018

The Bermuda Triangle

Last week followed my outline with minor exceptions starting with an early rally to the SPX 2680-85 area on both Mon and Tues before a selloff and a rally back toward the 2680 area by the end of the week.  The selloff was intensified by even stronger SELLs by the Risk Aversion Indicator Mon and Tues AM as well as a near SELL from the VIX Call Indicator on Tue 4/17 (up 47% of mean from low vs 50% official).  Next week I will start posting updates of the DM/SM Indicators on Twitter when appropriate as most should have adequate exposure to interpret their meaning by then.

I. Sentiment Indicators

The overall Indicator Scoreboard (outlook two to four months) has moved back to a more positive reading within a positive INT outlook.


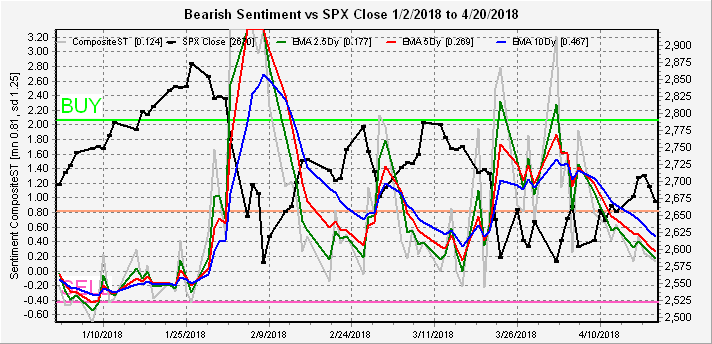
The Short Term Indicator (VXX $ volume and Smart Beta P/C, outlook two to four weeks) has, however, moved to a more negative outlook, indicating that the downturn started last week has more to go before an INT upturn.  As discussed later, this is likely pointing to a retest of the SPX triangle lows below 2600 over the next several weeks.


Bearish bond sentiment (TNX) saw a sharp spike higher last week as the TNX briefly tested 3.0%, but I have been wondering about the runup in rates over the last few weeks.  The runup started right after Trump announced the second round of tariffs with China, so when China did not respond in kind perhaps they sold US bonds instead.  Now we have Treasury Secretary Mnuchin scheduled to go to China to discuss trade.  Will a solution bring rates back down?


The gold miners (HUI) bearish sentiment continued to climb as gold miners dropped with the rise in rates and the longer sentiment (blue) has the reached the mid-Dec 2017 level which was followed by a 25 pt jump in the HUI.


II. Dumb Money/Smart Money Indicators

This week I want to start with a blow by blow followup of the The Risk Aversion/Risk Preference Indicator (SPX 2x ETF sentiment/NDX ETF sentiment, outlook 2 to 4 days/hours).  Even though Fri close was at a SELL, I indicated last week that a move up to SPX 2680-85 was likely before a downturn and Mon saw a move up to 2683 before closing at 2670.  A hour before the close sentiment looked like this.


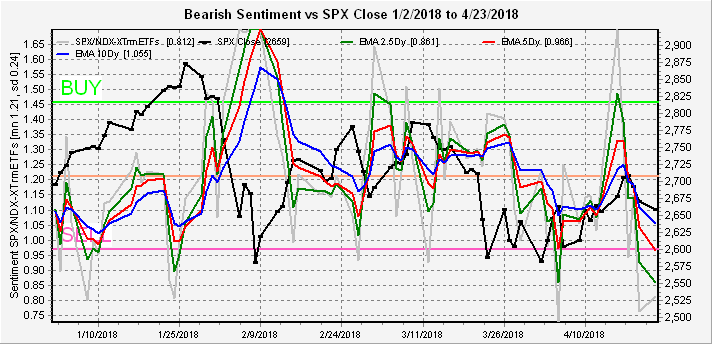
Tues AM the SPX again tested the upper range at 2684 before dropping to a low at 2617 and closing at 2635.  An hour after the open with the SPX at 2667  the sentiment looked like this.


But by an hour before the close sentiment looked like this, and the result was an end to a sharp one day decline followed by a rally into Fri AM.


The strong open in the NDX on Fri (up 100 pts) again resulted in a strong SELL 20 min after the open as shown below.  This time the result was only a 0.5% drop in the SPX (but 2% in the NDX) over the next two hours.


The end of week result is shown below.  As sexy as the above reults may seen there is a potential problem with the Risk Aversion Indicator due to cyclicality where the yellow lines represent a possible trend.  So the current SELL similar to last Fri may be weaker than it seems.


Here is the Risk Aversion Indicator INT look from early 2017, so we may be doing something similar to May of 2017.


This is why I rely on the regular Dumb Money/Smart Money Indicator as it is more stable on the INT time frame.


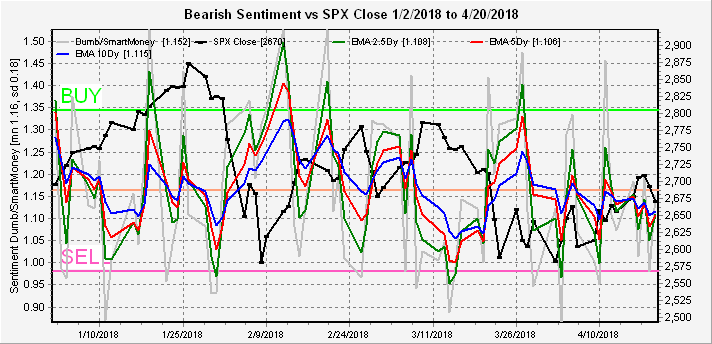
Moving on to the short term Dumb Money/Smart Money Indicator (outlook 2 to 4 days/hours) the two weak SELLs near SPX 2700 two weeks ago were followed by two weak BUYs last week.  The first BUY at the Wed close was followed by a gap open of SPX 15 pts with a high of +40 pts before a drop into the close.  The second was Fri at the close, so we are likely to start the week on a strong note, where a 40 pt up move from SPX 2670 targets the 2710 area.


The DM/SM cyclical component (outlook 2 to 4 days/hours) improved slightly with the pullback last week.


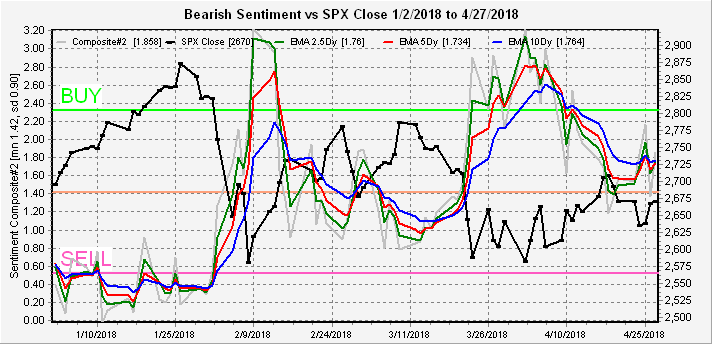
The INT term SPX Long Term/Short Term ETFs (outlook two to four months) improved last week but has not begun the sharp move up seen in Aug 2017 that should proceed an INT rally.


The INT  NDX Long Term/Short Term ETF Indicator (outlook two to four months) has moved back to the neutral level seen in Aug 2017 so the lows for the NDX may not be much lower.


III. Technical Indicators/Other

I had been paying so much attention to the new indicators that I forgot to check on the VIX Call Indicator, but on Apr 17 it did increase by 47% of the mean from a recent low where 50% is a SELL.  So higher volatility may be expected for three weeks following Apr 17.  (Due to Jan drop scale is actually SPX %/3).


The triangle in SPX since January has held up much better than I expected and a near term conclusion may be indicated by sentiment.  The DM/SM Indicator weak BUY is indicating a retest of the SPX previous high near 2717 close to the upper trend line over the next few days, while the ST Indicator, VIX Call Indicator, and Risk Aversion Indicator are pointing to a test of the lower TL near 2575 over the next two weeks.  The hourly charts also suggest an inverse H&S also pointing to SPX 2717 over the next few days.


IV. Options Open Interest

I did not post an update of the Fri SPX OI, but for those who follow on their own, a large number of calls were added Thur at 2675 that pushed the expected close down to the 2665-70 range (act 2670).


For next week M/W/F all have large positions (10k contracts x 100 sh x 2650 price = $2.65B).  Mon Apr 30 EOM, puts dominate below SPX 2660 with not much call resistance until 2725 with puts and calls mostly cancelling each other out at 2675 and 2700, so a move over 2690 is likely to run to 2720.  No estimate for expected close.


For Wed May 2 FOMC Day, there's not a lot of put support until SPX 2600 with strong call resistance at 2680, so a move below 2680 could drop to 2600.  Expected close 2680.


For Fri May 4 NFP Day, there's strong resistance at SPX 2700 and above, strong support between 2600 and 2650, but little below until 2560.  Expected close 2670.


I also wanted to take a look at AAPL since EPS after Tues close may set the tune for NDX short term.  Current price $162.  AAPL faces a lot af resistance at $165 and higher but little support except at $150, bad news could send the stock reeling while good news may only have a temporary effect.


Finally, a look at GDX which does not look promising.  Currently $22.7, there is stiff resistance at $23 but a move over $23-4 could create some serious delta hedging upward pressure.


Conclusions.  Next week could prove to be a very interesting week with a DM/SM Indicator BUY and SPX options indicating the potential for an early week run toward SPX 2720.  Then we have Tues close AAPL results and Wed aft FOMC results which are expected to be hawkish and a brewing Risk Aversion SELL setup similar to last week.  Finally, to end the week we have the Apr non-farm payroll release coupled with a VIX Call Indicator SELL entering its third week.  Most likely results seem to be a test of the SPX 2017 level Mon/Tue (or possibly Wed AM with good AAPL results), followed by a sharp reversal that tests the lower boundary of the SPX triangle at the 2575 area.  Sharpness of decline may depend on updated Risk Aversion readings.

Weekly Trade Alert.  Possible 1-2 day SPX long targeting 2710+ area.  Short SPX 2715ish with target next two weeks below 2600.   Updates @mrktsignals.

Investment DiaryIndicator Primer,  update 2018.03.28  Dumb Money/Smart Money Indicators
Article Index 2018 by Topic
Article Index 2017 by Topic
Article Index 2016 by Topic
Long term forecasts

© 2018 SentimentSignals.blogspot.com

Saturday, April 21, 2018

What's going on with interest rates?

Last week certainly started off with a bang with my target of SPX low, mid 2700s being met Tues before a consolidation on Wed, then a tech selloff Thur-Fri.  Now we know what happens when dumb money buying leads techs higher.  All in all, the SPX was up 0.5% for the week, blah indeed.  Although not receiving much attention, the reason for the selloff was likely the continued rise in rates with both the two and ten year bonds making new closing highs for this cycle.  The implied prob of a Fed funds hike to 2.0% in June is now 84%.  One of the dumb/smart money indicators did do a good job of predicting the markets turns for the week.

I. Sentiment Indicators

The overall Indicator Scoreboard (outlook two to four months) declined sharply during the week closing near the lows, similar to the levels at the Mar top.  It's very possible that sentiment stays above the mean for a while to balance the five months spent below the mean at the end of 2017.  Does this mean a possible trading range of SPX 2550-2750 to the summer?


The Short Term Indicator (VXX $ volume and Smart Beta P/C, outlook two to four weeks) has also fallen to levels similar to recent tops, so we are likely starting a moderate correction to the mid-low SPX 2600s thru the end of Apr/early May.


Bearish bond sentiment (TNX) remains very high, but may be repeating a mirror image of Q3.2017 when rates fell even though sentiment was very low, before finally reversing.


The gold miners (HUI) bearish sentiment jumped sharply as rates rose last week, but three of the last four times sentiment was this high, the HUI jumped 10 to 15 pts over a short period of time.


II. Dumb Money/Smart Money Indicators

The regular  Dumb Money/Smart Money Indicator was stuck below neutral last week, but the Risk Aversion/Risk Preference Indicator captured most of last weeks price swings, so I want to look at this indicator in more detail.

The INT term SPX Long Term/Short Term ETFs (outlook two to four months) is little changed, remaining slightly below neutral.


The INT  NDX Long Term/Short Term ETF Indicator (outlook two to four months) fell to the level of the late June 2017 top and met with an immediate selloff.  Even though the price decline was roughly equal to the early Aug 2017 decline the change in sentiment was subdued, indicating lower prices are likely eventually.


The Dumb Money/Smart Money Indicator (outlook 2 to 4 days/hours) showed slight negative leanings at the close on Tues and Thurs, but no SELL indications.


The DM/SM cyclical component (outlook 2 to 4 days/hours) did fall sharply last week, however, but remains above the levels of previous tops this year.


The Risk Aversion/Risk Preference Indicator (SPX 2x ETF sentiment/NDX ETF sentiment, outlook 2 to 4 days/hours) closed last Fri below neutral but an hour after the Mon open was showing a weak BUY (at SPX 2678) that strengthened during the day, Wed saw a sharp drop to below neutral, was flat for Thur, then moved to a SELL Fri an hour after the open.  I expect a bounce early next week, so do not treat this as a SELL for Mon.


Last week, I checked the reading each day an hour after the open, at mid-day and an hour before the close.  Hopefully in a couple of weeks I can begin posting on Twitter.  Here's what the indicator showed an hour after the open Mon at SPX 2678 that reached 2717 by Wed.


Here's what the indicator showed Wed  an hour after the open at SPX 2710.


And on Fri, this time I forgot to look until 1.5 hours after the open at SPX 2679 before the drop to 2660.  Next week I am going to try at 0.5 hours after the open to see how reliable that may be.


III. Options Open Interest

Last week I forgot to include the "or sooner" in my outlook as the SPX 2700+ area was captured much sooner than expected and almost made a round trip by Fri.  Sometimes I feel that the "algos" are front running my trades.  This week there is a lot of overlap by puts and calls so support/resistance may not hold, also Fri 27th and Mon 30th have very large (3-4x) regular open int size so are likely to dominate.

Mon 23rd, there is strong support at SPX 2625 and resistance at 2680, but over 2680 puts at 2700 and 2710 may act as magnets.  Likely range is 2650-80.


For Wed 25th, there is so much overlap between SPX 2650 and 2700 that it's hard to even guess.


For Fri 27th, we have very large open int size and most of the puts are SPX 2675 and lower, while most of the calls are 2690 and higher, so sometime during the week we should see 2680-85 which is the expected close Fri.


For Mon 30th, again a very large open int day, calls overlap puts all the way down to SPX 2650, so we could see a sizable drop all the way to 2640 with an expected close from 2660-70.


Conclusions.  The interest rate outlook is changing so rapidly that is hard to keep up, but the surge in the TNX to 2.95% increases the likelihood that a move over 3.0% will occur sooner.  The recent drop in INT term sentiment to neutral will likely continue into June if the SPX continues to trade between 2650 and 2750 which can provide the recipe for another 10-12% drop down to the SPX 2400s.  One possible scenario is a bounce next week to SPX 2685ish, then drop to 2640-50, which may be followed by a final rally into mid, late May to 2740-50.

Weekly Trade Alert.  None this week.  Potential for a short from SPX 2680-5.  Long oppty likely next week.  Updates @mrktsignals.

Investment DiaryIndicator Primer,  update 2018.03.28  Dumb Money/Smart Money Indicators
Article Index 2018 by Topic
Article Index 2017 by Topic
Article Index 2016 by Topic
Long term forecasts

© 2018 SentimentSignals.blogspot.com

Saturday, April 14, 2018

Blah Markets Ahead?

After starting the week on a weak note, Tues seemingly conciliatory position by China in response to Trump's latest tariffs pulled the SPX back to the mid 2600s where it stayed the rest of the week.  Numerous indicators are pointing to a consolidation with an upward bias to the low, mid SPX 2700s before the next period of turbulence, likely starting mid-May.  For those EW followers, a popular EW analysts @OntheMoneyUK has come to about the conclusions that I have.

I. Sentiment Indicators

The overall Indicator Scoreboard (outlook two to four months) remains at very high bearish levels, but has dropped sharply the last week due mostly to lower put/call ratios.  The market should maintain a positive bias, however.


The Short Term Indicator (VXX $ volume and Smart Beta P/C, outlook two to four weeks) has dropped to neutral territory more indicative of consolidation.


Bearish bond sentiment (TNX) remains elevated and has me wondering if the Fed may be more intent on raising rates to slow the economy than I expected.  Recent strength in the precious metals may indicate stronger inflation expectations.  Bond sentiment may be indicating a flattening of the yield curve, where higher S/T rates may not cause the TNX to rise over 3.0%, thereby not causing a stock market panic.


The gold miners (HUI) bearish sentiment remains near neutral allowing higher prices as the HUI continues to follow the inverted H&S pattern targeting 190.


II. Dumb Money/Smart Money Indicators

I am going to quit posting updates on Twitter for a few weeks as there seems to be a lot of confusion about the interpretation.  I have only been following these indicators for a couple of weeks, so I am no expert, but these are typically very short term, normally 2 to 4 days and sometimes 2 to 4 hours.  For instance on Mon two hours before the close, I posted an NDX ETF indicator showing that the EMAs had fallen below the horiz red/pink SELL line, but people got confused because I said investors were "all-in".  Use the color coding, the result was an SPX 40 pt drop by the close.

The INT term SPX Long Term/Short Term ETFs (outlook two to four months) has dropped to the neutral zone comparable to the July and Oct 2017 periods which were followed by consolidations.


The Dumb Money/Smart Money Indicator (outlook 2 to 4 days/hours) gave a weak SELL after the close Tue that was followed by a gap down opening Wed and a Wed BUY that was followed by by a gap up opening Thur.  Neither trade could be used by regular hour traders.  The current reading is neutral.


The DM/SM cyclical component  (outlook 2 to 4 days/hours) has declined from the extreme BUY zone, but remains in positive territory.  Buy the dip is still preferred, but not as strong.


The Mon NDX ETF call may have been a fluke, but I have been trying to use the ETFs to generate "before close" signals.  One option is a risk aversion/preference indicator (outlook 2 to 4 days/hours)  using SPX sentiment / NDX sentiment with 2x ETFs.  Ie, preference to SPX ETFs indicates risk aversion or bottoms, while preference for NDX ETFs indicates risk preference or tops.  The results are shown below.  This indicator peaked at the exact Feb bottom, and warned before the close Thur Apr 5th with a strong SELL before Trump announced the $100B China tariff and the SPX dropped 90 pts the next day.  No indicator is perfect but this looks like a good companion to the the DM/SM Indicator.


The NDX Long Term/Short Term ETF Indicator has fallen back into the INT cyclical pattern and will not longer be used as a ST indicator, now replaced with the Risk Aversion Indicator.  The decline in sentiment is comparable to late July 2017 which was followed by a consolidation period.


III. Technical Indicators

The SKEW is now forming a rounded bottom similar to early June 2017 which was followed by a one month consolidation.

On the interest rate front, the two year note rose sharply last week and is now showing an implied probability of 48% that the Fed will raise the funds rate to 2.0% in June.  The TNX is well off its highs, however, raising the possibility of a flattening of the yield curve which could mean a recession late 2018 or early 2019.  Tom McClelland recently showed an interesting piece showing how the two year note predicts Fed rate changes back to the mid-1990s, but I disagree with his cause and effect argument.

IV. Options Open Interest

There was a slight change to the Fri 13th outlook during the week, with additional puts pushing the expected close to the overlap at SPX 2650 (act 2656).


For Mon 16th, there is not much support/resistance between SPX 2630 and 2775, so 2630 may be a target if there is a strong reaction to Syria's missile attack, otherwise 2655-80 is likely to contain prices.


For Wed 18th, the numbers are not as big as they look due to auto-scaling, but there is good put support at SPX 2650 and 60 with call resistance at 2680 and little resistance over 2680.  Expected close SPX 2665-70.


The Fri 20th opt exp is very mild comparing the number of contracts, so this may mean a less volatile week.  There is strong support at SPX 2600 with the expected close at the overlap at 2700 and additional resistance at 2710.


Conclusions.  Overall indicators point to a slightly positive bias where a "buy the dip" outlook should be maintained. The S/T indicators are mostly neutral with options open int pointing to a Fri close near SPX 2700.  Big picture, it looks like the next three to four weeks will have a slight upward bias to the low, mid-2700s to be followed by a mild correction of 3-5% in mid, late May before a possible summer rally.  The interest rate outlook has changed since a flat yield curve seems more likely, not sure what that means for stocks.  OntheMoneyUK has an interesting chart showing one possibility of a consolidation, followed by pullback, then rally.

Weekly Trade Alert.  None this week.  Not sure what effects will be seen from Syria.  If Wed closes at SPX 2665-70, it may be good for a Fri pop to 2700. Updates @mrktsignals.

Investment DiaryIndicator Primer,  update 2018.03.28  Dumb Money/Smart Money Indicators
Article Index 2018 by Topic
Article Index 2017 by Topic
Article Index 2016 by Topic
Long term forecasts

© 2018 SentimentSignals.blogspot.com