
I. Sentiment Indicators
The overall Indicator Scoreboard (INT term, outlook two to four months) continued to fall with the 20 dy matching July 2017 and the shorter EMAs matching Dec-Jan 2018.

The INT view of the Short Term Indicator (VXX $ volume and Smart Beta P/C, outlook two to four months) also continued to fall, now nearing the July 2017 levels. Remember that the Aug 2017 decline, although relatively mild, sent bearish sentiment sky rocketing to levels matching the Aug 2015 flash crash. The result was my calling for a possible melt up in prices, but I do not expect sentiment to be as extreme this time until prices drop below the "triangle" lower boundary, now around SPX 2600.

Bearish bond sentiment (TNX) fell sharply last week with rates around 2.9% then rebounded later in the week. Sentiment has now fallen to a level where another move up over 3.0% could start any time.

Many analysts are now calling the 18 month sideways action in gold stocks a "basing period" before a large reflation rally, so this week I want to look back to 2014-15 where a similar 6 month basing period did not rally (just the opposite). Considering that bearish sentiment is lower now than then, I think the 2015 results may be more likely.

II. Dumb Money/Smart Money Indicators
This week since I am expecting an INT top, I want to look at the longer term (INT) sentiment picture. The Risk Aversion/Risk Preference Indicator (SPX 2x ETF sentiment/NDX ETF sentiment, outlook 2 to 4 days/hours) has now reached the INT SELL level within a downward sloping trend since Jan, now slightly exceeding the level of July 2017.

The option-based Dumb Money/Smart Money Indicator has now matched the level seen at the Jan top, only exceeded briefly in Dec 2017, and much lower than July 2017.

The INT term SPX Long Term/Short Term ETFs (outlook two to four weeks) continues to follow the pattern of July 2017 where the bearish sentiment rose to the mean in the middle of the consolidation period.

The INT term NDX Long Term/Short Term ETF Indicator (outlook two to four weeks) continues to remain above neutral as AMZN and NFLX continue to "dump" their services in foreign markets to gain market share and drive out the competition. I wonder how long it will take our trade partners to figure out the the US has converted to a service based economy, especially in the tech sector, and that a more proper response for retaliation against our "manufacturing based" tariffs is tariffs against our "service based" sectors that are dominating world trade. Otherwise sentiment seems to indicate that tech may be relatively immune to any trade war and may provide a "port in the storm".

III. Technical Indicators, Other
Last weeks report on the interest rate outlook seemed to be answered by the Fed on Wed by giving the rest of the world the fat finger. Since Trump appointed the new Fed chairman and several Fed governors I felt that was a possibility and the focus now seems squarely on "USA first".
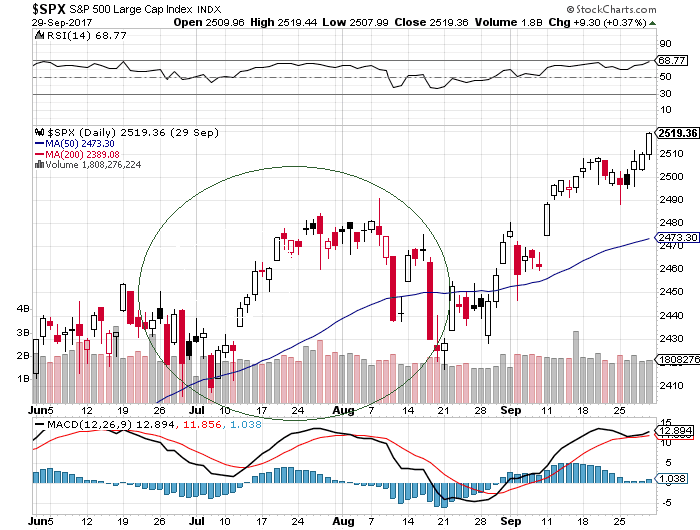
This week I want to take a closer look at the July 2017 SPX analog. From the early July low ,the SPX rallied 15 days, taking a 20+ pt dump on the sixteenth day (Jul 27), recovering most of the loss, then continued upward for 7 days, ending with a 10 pt spike above what had been a 15 pt trading range. Comparing to June 2018, from the recent low in May of SPX 2676, the market rallied 13 days before taking a 20+ pt dump Fri, recovering most of the loss, after trading in a 15 pt range of 2776-91. The next question is whether we see a similar spike high that would probably be 10-5 pts above the recent range (2801-06), then reverse? An additional 7 days is Tue 26th, while SPX options open int (below) hints at a possible Fri 22nd high above 2800.
I am not going to include a chart, but we have had about a month of very low VIX call buying, so there is no indication of a Jan-Feb crash. Surprisingly, we saw a similar pattern in July 2017.
IV. Options Open Interest
Using the Thur closing data. Last weeks Twitter updates indicated increasing put support in the SPX 2760-85 area, reducing downside risk. Mon has very small open int, but put support is SPX 2770-5 and call resistance is 2785-90. So we may stay around the 2780 level.

Wed has about twice as many contracts with moderate (overlapping) resistance at SPX 2780, but stronger resistance at 2800.

Fri is where it gets interesting, where there are about 5 times as many contracts as Wed and major resistance is at SPX 2805-10 with almost no support until 2725. The 45K contracts at 2820 were added Wed at a price near $3, so it makes me believe this may be "smart money" since the total value is over $12 million, but an early move over 2800 could be sold quickly, setting a sharp reversal. Wed-Fri could provide a possible high.

The following Fri Jun 29 (EOM) is somewhat more intimidating with large open int where there is strong resistance at SPX 2770 and less at 2750, but little support until 2730. A decline to SPX 2730-50 seems likely.

Conclusions. The overall sentiment picture has cleared up considerably since last weeks update with an almost unanimous top warning for the SPX. Continuation of the July 2017 analog points to a possible spike high for SPX of 2800-10 that is likely to reverse sharply by the EOM. The outlook for the NDX is less clear and may continue to outperform with weakness related to "trade wars", but remains more susceptible to duration or interest rate risk due to high P/Es. Bond sentiment has weakened enough that we could see a move back over 3% this summer if growth/inflation moves higher.
Weekly Trade Alert. I hope people realize that no guidance as last week means less certainty in outlook due to conflicting sentiment signals. This week has much stronger sentiment outlook for a top soon and reversal. Looking for a move over SPX 2800, up to 2810, to short, possible Wed-Fri with an EOM target 2730-50. Updates @mrktsignals.
Investment Diary, Indicator Primer, update 2018.03.28 Dumb Money/Smart Money Indicators
Article Index 2018 by Topic
Article Index 2017 by Topic
Article Index 2016 by Topic
Long term forecasts
© 2018 SentimentSignals.blogspot.com
No comments:
Post a Comment