
Last week I warned of a possible SPX 200+ pt pullback over the next 2-4 weeks with the initial leg down probably reversing to new ST highs over 4000 by the EOM. Wed was certainly a warning with a nearly 100 pt drop from the AM high on weaker the expected news on the economy, but Fri sharp rebound of 3% by the NDX helped to reverse much of the loss. Over the past month I have been buying tech equipment for a future upgrade to Win 11 as prices have been beaten down similar to the stock prices. With MSFT discontinuing support for Win 10 in Oct 2025, I wonder if many corporate IT managers may follow in my footsteps causing a mini-meltup in the NDX in 2024. This would certainly parallel the analogy made several weeks ago to the 1967 era. I can attest to the upgrade in security (mainly UEFI) as I prefer customized lite windows and initially many of the shortcuts that worked in Windows 10 are no longer available.
INT/LT sentiment remains mostly unchanged, while ST sentiment reversed sharply, now supporting a potential move to higher ST prices above SPX 4020 by the EOM.
I. Sentiment Indicators
The INT/LT Composite indicator (outlook 3 to 6+ months) has three separate components. 1st is the SPX and ETF put-call indicators (30%), 2nd the SPX 2X ETF INT ratio (40%), and 3rd a volatility indicator (30%) which combines the options volatility ratio of the ST SPX (VIX) to the ST VIX (VVIX) with the UVXY $ volume.
Update Alt. In this case the wts for the SPX 2X ETF ratio (SDS/SSO) and SPX puts & calls spread are adj to equal as in the DM/SM section for SPX ETFs.
Update, bearish sentiment remains low, but not extreme. The result may be somewhat like the 2021 topping period.


Update, last weeks extreme low bearish sentiment was expected to produce a 2-4 week pullback and Wed 100 pt SPX drop from the high was a warning.

Update EMA, very ST a sharp uptick in bearish sentiment may lead to more gains. A high around the EOM FOMC at SPX 4030-50 is possible.
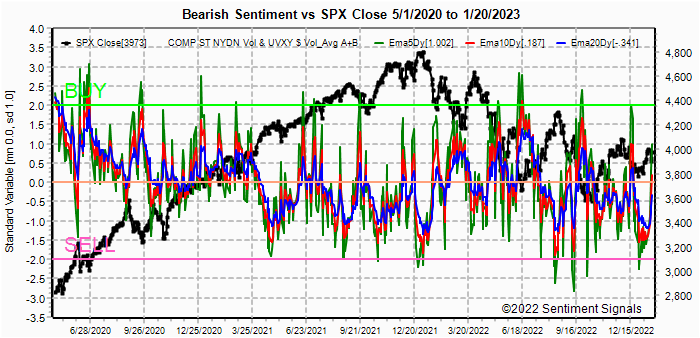
The VIX call & SPXADP ST indicator remains vey low, so the reprieve from last weeks selloff is likely to be short-lived.

Update EMA, the temporary weak Sell has move back to neutral.


Update, bearish sentiment has increased somewhat, probably due to the outlook for lower inflation.

II. Dumb Money/Smart Money Indicators
This is a new hybrid option/ETF Dumb Money/Smart Money Indicator as a INT/LT term (outlook 2-6 mns) bearish sentiment indicator. The use of ETFs increases the duration (term).
Update, sentiment continues to hover around the Sell level.

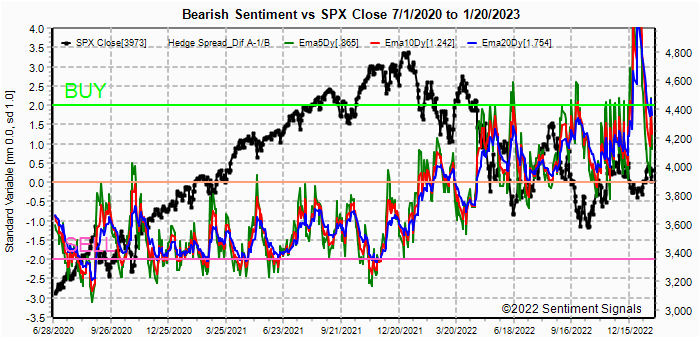

The sharp rally in the NDX based on good news from NFLX, may
be indicative of a longer term trend as the MSFT upgrades to Windows 11 may spur
investments in that area.

III. Options Open Interest
Using Thur closing OI, remember that further out time frames are more likely to change over time, and that closing prices are more likely to be effected. Delta hedging may occur as reinforcement, negative when put support is broken or positive when call resistance is exceeded. This week I will look out thru Jan 31. A text overlay is used for extreme OI to improve readability, P/C is not changed. Also, this week includes a look at the GDX for Dec exp. A new addition is added for OI $ amounts with breakeven pts (BE) where call & put $ amounts cross.
With Fri close at SPX 3973, options OI for Mon is small with no real put support until 3850 and some call resistance over 3950. So a small pullback to 3950 or lower is likely.


IV. Technical / Other - N/A
Conclusions. Last weeks short pullback was certainly enough to get the bears growling again, and all the talk seems to be of when, not if, the economy enters into a recession. Previously I indicated that a slowdown was expected to about 1% GDP growth as stimulus-lead growth leaks out of the economy, but a recession may not happen. For stocks a trading range from lows of 3750-800 and highs of 4150-200 may be all we see for 2023, with the potential for a tech led blowoff in 2024 to test the SPX ATH.
Weekly Trade Alert. Next week is likely to be somewhat boring with a potential range of SPX 3925-4000. Updates @mrktsignals.
Investment Diary, Indicator Primer, Tech/Other Refs,
update 2021.07.xx Data Mining Indicators - Update, Summer 2021,
update 2020.02.07 Data Mining Indicators,
update 2019.04.27 Stock Buybacks,
update 2018.03.28 Dumb Money/Smart Money Indicators
Article Index 2019 by Topic, completed thru EOY 2020.02.04
Article Index 2018 by Topic
Article Index 2017 by Topic
Article Index 2016 by Topic
Long term forecasts
© 2022 SentimentSignals.blogspot.com
No comments:
Post a Comment