I. Sentiment Indicators
The overall Indicator Scoreboard is little changed from last week as the level of bearishness is about as low as it can go.
The Short Term Indicator (VXX $ volume and Smart Beta P/C) has continued to hover at levels that marked the mid-2015 top in May and July. Based on the behavior of its components the ultimate low equivalent of Apr 2015 may have already been seen last July.
The VXX $ volume has finally dropped back to the SELL level which we saw late Apr 2015 about a month before the top in the SPX.
The Smart Beta P/C continues to inch up as we saw in May of 2015 with the earlier bottom in Dec 2017 matching the late Apr 2015 SELL. Overall, I am now considering the ST Indicator on a SELL even though the components are out of sync.
The NDX short term ETFs SQQQ/TQQQ shows increased levels of bearishness even as the index has moved up 100 pts since last week. The 7000 level is looking more likely.
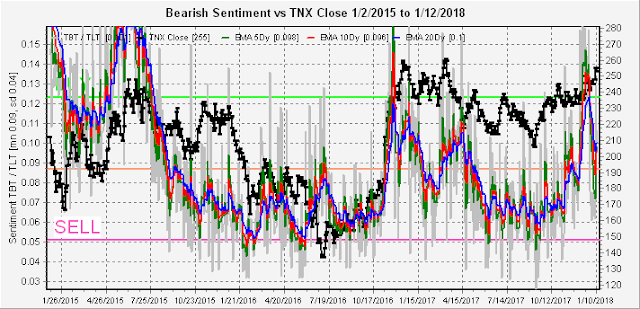
Bond sentiment (TNX) reversed sharply last week, which may presage a final spurt upwards as we saw in Dec 2016 or not. Interestingly there have been a couple of news events lately (China selling US bonds, bond guru warnings) that saw an AM spike to just below 2.6%, matched by weakness in stocks, then rallies in stocks and gold as rates fell back towards 2.55%. A break above 2.6% may be a warning for stocks.
The gold miners (HUI) saw bearish sentiment rise as the HUI moved back to the 200 level that may allow for slightly higher prices.
II. Options Open Interest
Prices only fell below the SPY 273 level for a few minutes then delta hedging continued to push prices higher thru Fri (close SPY 277.9, SPX 2786). Next week looks like it will be more of the same. For Wed, a move below SPY 276 could drop to the "most likely" at 275, but over 276 delta hedging supports higher prices.
For Fri monthly optn exp, with SPY higher than 275 delta hedging supports higher prices to 280, a push over 280 has clear sailing upwards. For Fri put support is not important.
III. Other
Last week saw a large jump in VIX call buying, larger and sharper than the early Aug 2017 period, which was followed by an SPX 74 pt plunge in two weeks. Due to the low holiday vol, I have incorporated the same market vol adjustment used in the VXX $ vol since Jan 2016. Mon saw 1.2M calls mostly Feb 14, Wed saw 2.2M evenly split between Jan and Feb with 300k 15s and 500k 25s each month that appeared to be a maturity spread (buy/write) so I dropped the number to 1.2M as a conservative read of the hedging potential. Fri saw about 1.0M with 60/40 Feb and Mar. The increase is now 78% of the avg vol.
Conclusions. The recent run up has changed my outlook for a mid-month pullback and rally into EOM to a more imminent top. Momentum may carry the market upward to the SPX 2850 level next week then consolidate to EOM. Some Fed heads are talking about more forceful action to slow markets down, so Jan's FOMC (30-31) may give markets a pause EOM. Using the VIX Call Indicator with the confirmation by the ST Indicator, my outlook is for a 3-5% pullback starting late Jan-early Feb and lasting 2-4 weeks. Will the bears growl like they did with the Aug pullback causing another bullish romp?
Investment Diary, update 2017.10.28, Indicator Primer
Article Index 2017 by Topic
Article Index 2016 by Topic
© 2017 SentimentSignals.blogspot.com


No comments:
Post a Comment