Two weeks ago, I began warning that the traditional Santa rally was likely to be disappointing, but a January surprise was likely. Was it ever, with an almost 70 pt rally in the SPX in 4 days. My logic was that January is considered an important, but often misleading, indicator of the future for the stock market. Similar to the January 2016 decline which turned many bearish before a 50% rally, a top this year is likely to be preceded by a strong January. Only time will tell. The long term forecast contrasts growth and interest rate outlooks.
I. Sentiment Indicators
The overall Indicator Scoreboard retreated back to the SELL area after a brief increase in bearishness the prior week.
The Short Term Indicator (VXX $ volume and Smart Beta P/C) declined slightly, but remained above recent lows.
The components of the ST Indicator are starting to show a divergence as the VXX $ volume is starting to fall sharply similar to late Apr 2015 before a pickup in volatility.
While the Smart Beta P/C has been inching up as was seen in early May of 2015. With the major ETF sectors of SPY, QQQ and IWM, this may be due to continued hedging in the NDX/QQQ as seen in the following chart.
The NDX short term ETFs SQQQ/TQQQ still show relatively high levels of bearishness even as the targeted 6700 area is approached, indicating that higher levels, possibly 7000 are likely.
Bond sentiment (TNX) continued to fall, indicating strong movement into TLT based on signs of moderate growth with little inflation. Still too early to tell what the effects of unwinding QE will be.
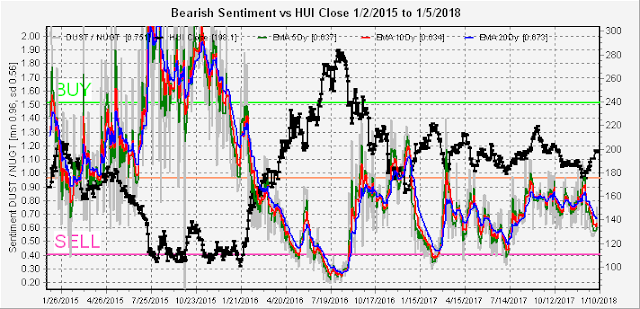
The gold miners (HUI) seem to be running out of gas as the targeted HUI level of 200 is reached.
II. Options Open Interest
Options OI was probably the best indicator of the runaway breakout in the SPY/SPX last week as the Opricot Fri chart by Wed showed a large buildup of puts supporting a rise to SPY 271.5 with little call resistance up to 274 (close SPY 273.4/SPX 2743).
Looking forward to the next two weeks, it looks like there could be a small pullback into mid month (SPX 2700 ish), but an EOM rally is likely. For Wed's SPY a move below 273 finds strong put support at 271 and a "most likely" at 272, but delta hedging provides support above 273.
For Fri, strong put support moves down to 270 and "most likely" at 271, but delta hedging provides support above 272.
For the monthly expiration, "most likely" is SPY 269 (SPX 2700) with puts and calls offsetting (hedged) at lower levels and at higher levels a move over 270 could push to 274. Could be a recipe for some volatility, especially if VXX $ Vol continues to drop.
Conclusions. The explosive rally seen last week has failed to move the ST Indicator to a SELL so more upside is possible but a pullback over the next two weeks to the SPX 2700 level is seen likely using options OI. More upside during earnings season seems likely, however, particularly in the tech/NDX sector
Weekly Trade Alert. I hope some of you have better trading success than I have lately. The Dec 29th selloff was simply a ploy to "shake out the weak hands" and resulted in my getting stopped out at BE, while the "gap and go" opens of the past week gave no apparent good entries. Last weeks possible Short was cancelled via Twitter when SPY rose over 270 Wed due to possible delta hedging. No specific trades this week, but a move to SPX 2750 may provide the opportunity for a small short if the VXX vol continues to decline thru Wed. Updates @mrktsignals.
Investment Diary, update 2017.10.28, Indicator Primer
Article Index 2017 by Topic
Article Index 2016 by Topic
© 2017 SentimentSignals.blogspot.com


No comments:
Post a Comment