
Personally, I prefer to adhere to Warren Buffets Rule #1 which is don't lose money since a 50% lose requires a 100% gain to break even. Most of the "bear market rallies" have only lasted 1 day and sometimes as little as 1 hour, so if you are a very nimble day trader you may have done OK, but I don't expect a tradeable rally until the Dec 2018 lows are tested at SPX 2350.
Speaking of dislocations, over the last 6 trading days the gold miners HUI index has fallen over 30% from 245 to 164 with the two biggest gold buyers on strike, first China selling to prop up their economy and now Russia not able to buy with an oil price war with the Saudi's. Specifically, on Thur Barrick Gold opened down 20% as sellers overwhelmed buyers, and Fri aft a massive sell order for GDX ETF drove prices down 25% during the day to 16.5 before a close at 19. ZH has been discussing the possibility of order imbalances for ETFs for months, and we are likely to see similar behavior for the broad mark avg ETFs such as QQQ and SPY before the crisis is over.
Although there are still some similarities to the Oct-Dec 2018 analog, this week I want to present a much more bearish analog using the 2008 financial crisis in the Tech/Other section that was presented in last week's Updates. In 2008, the first leg down was SPX -18% related to the Bear Stearns crisis thru Jan. With the first leg down in 2020 of 27% so far this could mean an ultimate low near SPX 1000, whew! Also a real-time indicator based on the TRIN is used for comparison.
I. Sentiment Indicators
The overall Indicator Scoreboard (INT term, outlook two to four months) bearish sentiment has risen sharply, now approaching the level of mid-Oct 2018, but this may be misleading due to the included 2X ETF sentiment (more in DM/SM section).

The INT view of the Short Term Indicator (VXX $ volume and Smart Beta P/C [ETF Puts/Equity Calls], outlook two to four months) bearish sentiment remains rather mild compared to Feb and Dec 2018. Way to much BTFD and belief in Fed interventions and bailouts. Last week I heard one trader say that the motto on the US$ should be changed from "In God we trust" to "In the Fed we trust", imagine what happens if faith is lost in FED interventions. Much more volatility ahead.

Bonds (TNX). Bond sentiment remain pinned to the lows, while interest rates remain low. I wonder what would happen to rates if the Fed stopped intervening, possibly something like the gold miners?

This week I wanted to look back to 2015 to see what a sentiment-based (3X EMAs) rally looked like, and compare it to today. The rally since mid-2018 has been based on talk of negative rates and collapse of the dollar, but looked what happened when rates collapsed - so did the gold miners. The gold miners (HUI) bearish sentiment remains near historical low levels, indicating that prices could fall much farther and stay down for a considerable period of time.

II. Dumb Money/Smart Money Indicators
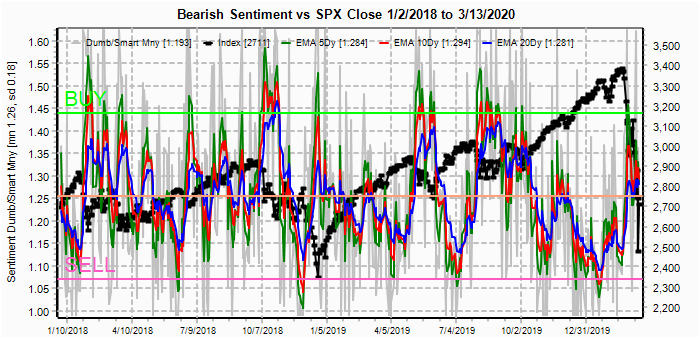
The option-based Dumb Money/Smart Money Indicator as short/INT term (outlook 2 to 4 mns/weeks) remains close to neutral, indicating that the Fed induced rally hopes of the BTFDers are likely to be crushed. Thurs & Fri call options volume on the SPX rose to 1.1 & 1.2M, over three times the daily avg of 350k and higher than any time as far back as I could go (2016).
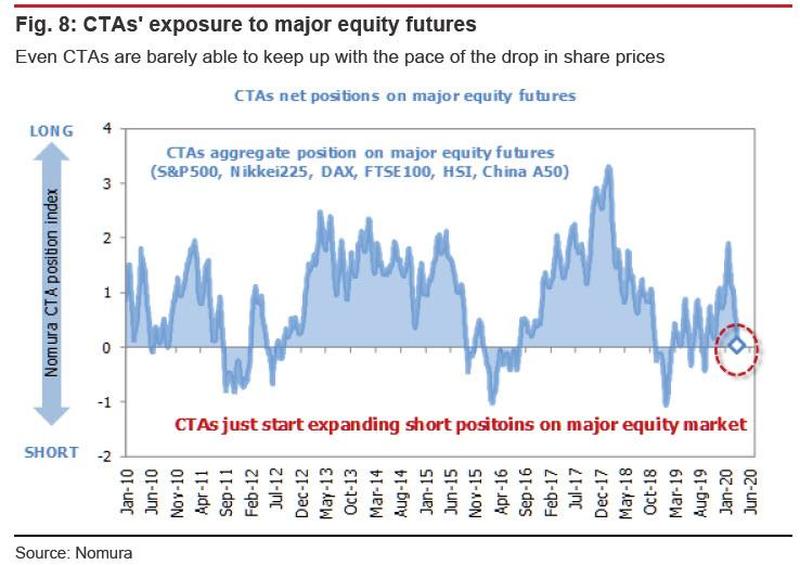
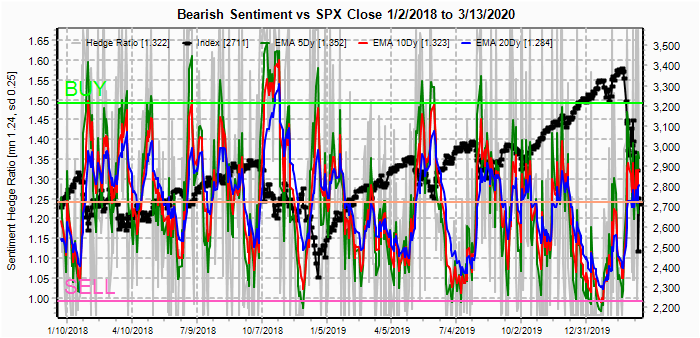
And the sister options Hedge Ratio sentiment is near neutral, indicating much more volatility ahead. An interesting article at ZH on hedging by Nomura about CTA hedging with a chart showing hedging at neutral (0) where -1.0 is usually seen at bottoms (now same as early Oct 2018).
This week I wanted to look at the SPX related DM/SM ETF indicator since extreme positions of the 2X ETFs may not be as impt, depending on the relative position to 3X ETFs. The most favorable outlook is DM (2X) selling and SM (3X) buying, but now both are strong sellers.
The INT term SPX Long Term/Short Term ETFs (outlook two to four wks/mns) bearish sentiment (2x DM/3x SM) has been a decent indicator for longer term outlooks and now shows that selling is stronger for DM with a slight positive bias, similar to Feb of 2018, but still a long way from a BUY. NDX SM/DM is inconclusive and is excluded.

III. Options Open Interest
With recent volatility extremes, SPX charts are of little use,
Using the GDX as a gold miner proxy closing at 19 from the prior weeks 29.4, last week showed a big increase of call resistance at 32-34 and only small put support at 27 and 25, and when prices fell below 25 the free fall began.
Currently the TLT is 153.9 with the TNX at 0.95%. Without Fed intervention, rates should rise with the TLT dropping to at least 147, but with an active Fed it is hard to tell. If rates do rise in spite of the Fed, it is probably an indication of a bigger problem.

IV. Technical / Other
First a look at the data mining indicator using the Equity P/C as SM compared to the overall CPC Revised. Although not perfect, higher levels are generally positive (missed Feb highs due to ext shock). Currently we have seen a rapid decline of about the same length as from the Oct 2018 lows to the Dec 2018 highs as Equity P/C is rising while ETC and SPX P/C are falling. Is another Dec 2018 style crash possible?

Looking at the 2008 analog, the first thing that jumps out is that the 2020 decline for a single day resembles the weekly decline for 2008 from the Oct 2007 high of SPX 1571 to the Jan low at 1270. After the low a 38% retrace 2 bars (week to 2020 day) and from 2480 from 3393 that is 2827, possible this week. Next came a lower retest that may be to Mar EOM and with the O/N ES low of 2400 Thur that could be 2350 in 2020. A somewhat larger retrace of 50% followed, now equal to about 2870.
2008 weekly.

2020 daily.

The TRIN or arms index is a complex ratio of advancing & declining issues and volume and is generally considered a FEAR indicator. Looking at the TRIN with 10 and 20 SMAs, which was selected based on similarity to some of my indicators, a rise to 1.25 is generally bullish (high fear) and a decline below 0.9 is bearish. Unfortunately the low last week left the TRIN SMAs near 1.0, well short of a bullish reading, so more volatility and/or lower prices are likely near term. This indicator is also updated intra-day so may be useful for spotting reversals or placing EOD trades.
2008.

2020.

Conclusions. One partial solution to the Covid-19 crisis is under development by Darpa which boosts the immune system to lessen the effect of the virus, This is still expected to take a couple of months to develop, but would probably alleviate a lot of fear for investors. The timing also lines up well with the 2020/2008 day/week analog.
The primary reason I mentioned the SPX 1000 level was that I think a break of the 2007 highs at 1571 would cause "true" panic and the expectation of a return to the 2009 lows. This may seem unrealistic, but the NYSE has already broken it's 2007 high, so who knows.
Otherwise, the general outline is in the Tech/Other Section.
Weekly Trade Alert. If we do manage a retrace to the SPX 2827 level this week with the TRIN around 1.0, that should provide a shorting oppty for a lower retest to SPX 2350. Updates @mrktsignals.
Investment Diary, Indicator Primer,
update 2020.02.07 Data Mining Indicators,
update 2019.04.27 Stock Buybacks,
update 2018.03.28 Dumb Money/Smart Money Indicators
Article Index 2019 by Topic, completed thru EOY 2020.02.04
Article Index 2018 by Topic
Article Index 2017 by Topic
Article Index 2016 by Topic
Long term forecasts
© 2020 SentimentSignals.blogspot.com
No comments:
Post a Comment