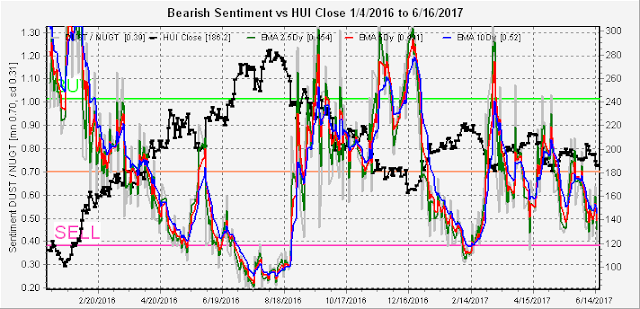
I. Sentiment Indicators
The overall Indicator Scoreboard showed that bearish sentiment rose steadily due to fallout from the tech decline even though prices were mostly flat outside of intra day declines. Similar trends in August 2016 was followed by lower prices, but in January by higher prices, so likely no imminent top.
The Short Term Indicator (VXX $ volume and Smart Beta P/C) using INT EMAs likewise rose with similar comparisons and conclusions.
Bearish sentiment for bonds (TNX) has moved back to the neutral range even though rates were flat which seems to indicate less demand for safety.
Sentiment for gold stocks (HUI) with ST EMAs provided the biggest surprise of the week, dropping to the recent SELL level, as BTFDers seem to expect the trading range (GDX 22-24) to hold up even though the options open interest shown last week showed that the range into July expiry (7/21) was likely to be GDX 21-23 or lower (HUI 160).
II. Options Open Interest
I did receive a question about the monthlies last week, so for those unfamiliar with options, the original monthly options expire the third Friday of the month. I will in the future try to use specific dates for clarity.
This week I will look at the Wed/Fri options as well as the June EOM (6/30). The Wed options show a surprisingly tight range between 243-4 with previous close at 242.6 and most likely Wed close at 243.5. Fri options show more bullish potential up to about the 246-7 level. Put resistance is fairly low, however, so downside surprises are possible.
The next (EOQ), shows more call resistance that is likely to push prices back down to SPY 243-4 level.
Looking forward to the July monthlies, there is a fairly flat range between SPY 240 and 246 with very stiff resistance at 247.
III. Technical Indicators
About a month ago, I revised my outlook upward based on a study of several bear market tops that showed rallies of 18-20% in the final six to eight months as a way to run in the shorts or "strangle the bear" as I called it last week, In particular, since I am looking for a 1970s outcome long term as a result of the QE quagmire, the first step would be a 1970-72 type bear market that was surprisingly mild, down only 20% after 2.5 years, before a final collapse that totaled 33%. The final 1960s rallies were 18 and 19% depending on which top you chose so the result from the 2016 election lows is SPX 2470-90.
The second item which I also noticed comparing 2017 price behavior to the past was the amazing similarity to 2014. Starting in Feb of both years, the SPX rallied strongly into early Mar, then started a trading range for three months of about 1900 to 1820 in 2014 and 2400 to 2320 in 2017. More amazing is that the numbers are off by an almost exact 500 pts. Both rallied out of the trading range in late May into early June to 1950 in 2014 and 2446 in 2017 with mid June pullbacks. In 2014, the SPX then rallied to 1960 late June before an EOM pullback to 1945, and early July hit 1985 with a larger pullback before a final July high of 1991. Will the SPX reach the same targets by adding 500 in 2017? Note prices eventually continued higher in 2014, but the sentiment picture was vastly different than today as shown by the LT SDS/SSO chart below.
The final technical indicator I want to cover today is a simplified version of the high risk composite I discussed several weeks ago as a measure of declining volume support for advancing issues shown using the TRIN, this indicator is the $NYAD:$NYUD which gives a warning about a month before an important top with a spike over 6.0. The five readings over the past two years included Oct 2015, Mar-Apr 2016, July 2016, Apr-May 2017, and last week. This may be due to the smart money (high volume traders) pulling out leaving the dumb money to pick up the crumbs.
Conclusions. Normally, I don't place a lot of confidence on historical analogs, but continued moderately high bearish sentiment seems to align with the 2014 analog so it may be worth a close watch. I may take a couple of short term trades off book where the options OI align with the 2014 analog.
Article Index 2017 by Topic
Article Index 2016 by Topic
© 2017 SentimentSignals.blogspot.com


Great post as always Arthur. I was thinking about a 10%+ pullback too, but recently I've changed my mind. I now think they plan on crashing it this fall (for reasons I don't want to post publicly). This top in July will likely be the end of the rally from the 2009 low and start a new bear market that will last until 2020 in my opinion.
ReplyDeletegreat post! reddragonleo or Arthur, whats your top target and timing? reddragonleo...whats the best way to get hold of you. raymondjonesmails@gmail.com
ReplyDeleteThanks