
I. Sentiment Indicators
This week I am going to looking at more of a variety in the indicators as we see both BUY and SELL indicators conflicting. The overall Indicator Scoreboard saw a sharp drop in bearishness, mostly due to a huge spike in call buying, to levels that have seen important tops or near tops in the past several years.

Looking at the CPC Revised (combined P/C less VIX options), there have only been two similar cases this low since 2015, Jul 2016 and Jan 2017, both resulted in consolidation or pullbacks. Given the Jan proximity to the BUY spike the previous Nov, Jul 2016 seems most relevant. This implies limited upside for a few weeks followed by a multi-month correction, most likely a top by early Jan 2018, followed by a 5-7% decline into Mar.

The Short Term Indicator (VXX $ volume and Smart Beta P/C) is telling a somewhat different story, with a large spike producing the equivalent of a ST EMA BUY (not shown).

Bond sentiment (TNX) saw bearish levels fall back to neutral as rates retreated slightly.

For the gold miners (HUI), sentiment and prices are mostly unchanged.

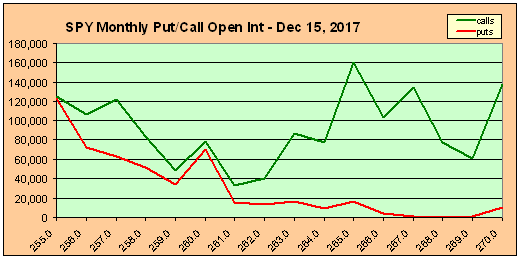
II. Options Open Interest
SPY open interest did not provide much of a clue last week as call resistance at 261 was easily overcome and ended up being support in Friday's mini flash crash. Next Fri shows strong resistance again at 265 (current 264.5) with "most likely" at 261, but given the ST Indicator ST BUY this is likely to be easily overcome.

For the Dec opt exp, ordinarily this would be very bearish, indicating a drop to at least SPY 260 and possibly 255, but as I showed similar sentiment out to Mar 2018 last week, what may end up happening is an "overrun" due to the tax bill plus seasonality and then a pullback into Mar 2018.
III. Technical Indicators
A couple indicators worth keeping an eye on are the $SKEW and the High Risk Volume Indicator. The SKEW early last week dropped to as low as 124 and would be expected to rise toward 140 before a Mar-Apr 2017 type pullback. The HR Vol Indicator measures supporting volume and had been rising toward the SELL level but last week's rallies showed strong supporting volume, pulling it back down. Fridays very strong VIX call buying again gave a weak BUY, rising by 46% of average.
Conclusions. Two weeks ago, I indicated that positive ST sentiment plus progress in the Senate on the tax bill would likely carry the market over SPX 2600 thru Dec 1. So I got the dates right (off by 1 day) but missed the upside target by almost 40 pts, but bubbles surprise to the upside. We need to have a consolidation period to wear down the bears and the extreme put/call ratios indicate this should occur soon, but the spike in the ST Indicator points to more upside. The net result should be a positive bias into year-end, but a more subdued advance with a year end target of 2700+.
Weekly Trade Alert. The spike in VXX volume has usually resulted several more days of volatility before the rally resumes, so I am looking for a "sell the news" retest of the recent lows. Tentative Long SPX 2605-10 but with a lot of hesitation. Updates @mrktsignals.
Investment Diary, update 2017.10.28, Indicator Primer
Article Index 2017 by Topic
Article Index 2016 by Topic
© 2017 SentimentSignals.blogspot.com
No comments:
Post a Comment