
A tossup it was. Last week, faced with little directional sentiment
bias, I simply called for a "tossup" in the trade alert section. Although
I expected positive inflation news could produce a retest of the SPX 4195 area,
the overall outlook remain for lower lows in May, probably SPX 4000 or lower.
Instead, concerns over the debt limit deadline seemed to override other news and
"good" CPI and PPI only resulted in a trading range from SPX 4100-50. This
seems to be an almost annual event and I saw an article that since 1960 the debt
limit has had to be raised 78 times or about 1.2 times a year and there has
never been a default, so probably just more bear porn. This did remind me
of something I had seen before, so I pulled up an old chart of May 2015 (below).
Although I don't expect an exact repeat, one possibility that could come close is
a rise in int rates (TNX) to 4%+ in the Fall with a soft/no landing and a pickup
in growth (selloff #1), then early 2024 a "pivot" from those expecting the Fed
to cut rates to one expecting more rate hikes (selloff #2).

The biggest change in sentiment this week came from sharply lower bearish sentiment in hedging and in the NDX, although the ST composite is at a near weak Buy. With NDX providing most of the support for the SPX this year, a pullback thru the end of May into the debt limit X-date of June 1 seems most likely. Then a positive debt limit outcome and a Fed pause should provide fuel for a positive June. I still have a 13.7k target for the NDX, but no definite target for SPX (maybe 4250 with recent lag of NDX). Simon at iSPXETF expects at least a gap fill at 4218 and possibly a 61.8% retrace of the 2022 bear at 4300+.
Some small indicator changes this week with the INT/LT Composite VIX volatility ratio replaced with the spread as explained in Tech/Other and the SPX options adj for the DM/SM Indicator replaced with a more compatible SPX options DM/SM indicator.
I. Sentiment Indicators
The INT/LT Composite indicator (outlook 3 to 6+ months) has three separate components. 1st is the SPX and ETF put-call indicators (40%), 2nd the SPX 2X ETF INT ratio (30%), and 3rd a volatility indicator (30%) which combines the options volatility spread of the ST SPX (VIX) to the ST VIX volatility (VVIX) with the UVXY $ volume. This week breaks SPX options into volume adj (1/B-A) and traditional spread (A-B) and replaces volatility ratio with spread.
Update Alt. In this case the wts for the SPX 2X ETF ratio (SDS/SSO) and SPX puts & calls spread are adj to equal as in the DM/SM section for SPX ETFs. Bearish sentiment remains near the weak Sell down slightly for the week.


Update. Bearish sentiment rose to just below the weak Buy level and may support prices for optn exp week.

Update EMA. Bearish sentiment rose for the week to the highs of the last two weeks and may delay any breakdown.

Update EMA. Bearish sentiment fell sharply with a decline in hedging and likely means an increase in volatility.


Update. Bearish sentiment remains near the weak Sell with neutral ETF sentiment.

II. Dumb Money/Smart Money Indicators
This is a new hybrid option/ETF Dumb Money/Smart Money Indicator as a INT/LT term (outlook 2-6 mns) bearish sentiment indicator. The use of ETFs increases the duration (term). A change was made to reflect a more consistent option adj with DM/SM outlook.
Update. Bearish sentiment declined sharply to the weak Sell level.


For the SPX, I am switching to hybrid 2X ETFs plus SPX options. Taking a look at the INT term composite (outlook 2 to 4 mns), bearish sentiment rose slightly to near neutral.

Bearish sentiment bearish sentiment fell sharply, indicating a moderate pullback is likely. Market performance is expected.

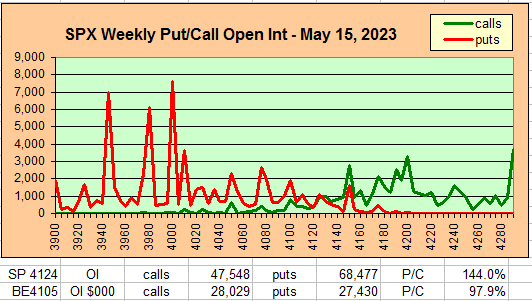
III. Options Open Interest
Using Thur closing OI, remember that further out time frames are more likely to change over time, and that closing prices are more likely to be effected. Delta hedging may occur as reinforcement, negative when put support is broken or positive when call resistance is exceeded. This week I will look out thru May 19. A text overlay is used for extreme OI to improve readability, P/C is not changed. A new addition is added for OI $ amounts with breakeven pts (BE) where call & put $ amounts cross.
With Fri close at SPX 4124, options OI for Mon is small with only minor put support at 4075 and call resistance starting at 4150. A drop below SPX 4100 is likely.


For Fri PM SPX OI put support extends up to 4125 if SPX makes it to 4100, below 4100 the ITM calls may exert pressure down to 4050-75.

For May 31, EOM moderate OI indicates call resistance at SPX 4100 and higher while strong put support is at 4000. Likely range is SPX 4000-4100.

IV. Technical / Other
After reading a couple of articles last week about how the low VIX meant the return of a bear market, I decided to take a look at the VIX indicators. Currently, I use three VIX measures: the 1 mn VIX, the 3 mn VXV (or VIX3M), and VIX volatility VVIX. A new indicator for same day options came out recently, VIX1D, but there is no history. Common uses are the VIX term structure VIX/VXV and VIX volatility ratio VIX/VVIX, both are shown below. The VIX volatility ratio is clearly a better LT indicator and is used in the INT/LT Composite.


I hadn't looked at the individual components before and when i did I noticed the Buys tend to occur when VIX (grn) is higher than VVIX (red), and Sells when red is higher than grn.


The following uses barcharts.com as a source and discusses S&P futures (ES) as a third venue of stock sentiment in addition to options and ETFs. The non-commercial/commercial spread represents a LT bearish sentiment (dumb money/smart money) indicator. As explained in investopedia, commercial investors (red) are institutions and are smart money, while non-commercials (green) are speculators such as hedge funds and are dumb money. Here is the current barchart graph for the S&P 500 (top) and trader positions (1st bot) with positives as net longs and negatives as net shorts. Bearish sentiment is represented by the spread and is positive if red > green (Buy) and negative if green > red (Sell). Sentiment remains a strong BUY.
Conclusions. "Sell in May" has failed to produce the expected
results so far, even with bank failures, CRE problems, and debt limit impasse,
so what goes? Very possibly the cheerleading bears are ignoring the fact
that record amounts of stimulus and one year of interest rates going from 0 to
4%+ are not enough to offset all of the accumulated funds borrowed over the last
ten years at record lows. INT/LT sentiment still indicates that a
significant correction (10%+) is still likely several months away, and current
price patterns and timing are similar to mid-2015 that points to potential
problems in the Fall. Tech stocks that have been leading the market were
likely aided by one-time cost reductions (layoffs) and may suffer if int rates
rise and EPS levels off.
Weekly Trade Alert. Some inital weakness below SPX 4100 (4075
possible), then bounce mid-week (4100+) before a fade toward 4150 by EOW.
SPX 400 looks possible by EOM. Updates @mrktsignals.
Investment Diary,
Indicator Primer,
Tech/Other Refs,
update 2021.07.xx
Data Mining Indicators - Update, Summer 2021,
update 2020.02.07 Data Mining Indicators,
update 2019.04.27 Stock Buybacks,
update 2018.03.28 Dumb Money/Smart Money Indicators
Article Index 2019 by Topic, completed thru EOY 2020.02.04
Article Index 2018 by Topic
Article Index 2017 by Topic
Article Index 2016 by Topic
Long term forecasts
© 2023 SentimentSignals.blogspot.com
No comments:
Post a Comment