
Last weeks stock market unfolded much as expected with an early retest of the previous Fri lows at SPX 4450 (4465) before a rally to test the previous weeks highs at 4595 (4590) before resuming a more serious downturn to test the Jan lows. On Fri, I saw the potential for one more rally attempt as long as 4450 held (omitted from update), but the mid-day warning of an emminent Russian invasion of Ukraine triggered a jump in oil and bonds and sent the SPX to the low 4400s, but consider me skeptical.
Much of Russia's concerns regarding Ukraine trace back to the 1980's when the progressive Russian leader Gorbachev agreed to the re-unificarion of Germany if the US/NATO agreed to leave the countries surrounding Russia neutral, but he forgot to "get it in writing" and as a result NATO expanded eastward, thereby violating the agreement and threatening Russian security. The second area of contention is the oil/gas pipeline Nordstream 2 which a cheaper alternative to import oil/gas from Russia to Germany and this the US/NATO views as allowing Russia to increase political pressure over Europe. My view is pretty much summed up by a recent Project Syndicate article (free version). The recent hype about an imminent war seems more likely to be false info leaked by the Russians to the CIA to pressure the US, or false info leaked by Biden's admin to make him look like a hero saving the world from Commie aggression when a diplomatic solution is announced, thereby bolstering his low ratings. Interestingly, Merriman this week discusses an astral cycle which points to an important diplomatic break through soon.
It's becoming difficult to tell whether prices or sentiment are more volatile as several important indicators have moved from extreme low bearish levels to extreme high bearish levels since the beginning of the year which may lead to a stronger/longer rally than expected (aka 2018).
I. Sentiment Indicators
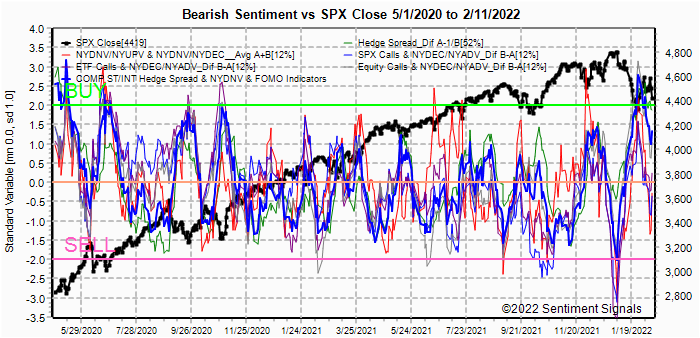
The INT/LT Composite indicator (outlook 3 to 6+ months) has three separate components. 1st is the SPX and ETF put-call indicators (30%), 2nd the SPX 2X ETF INT ratio (40%), and 3rd a volatility indicator (30%) which combines the options volatility ratio of the ST SPX (VIX) to the ST VIX (VVIX) with the VXX $ volume.
Update. Current INT/LT sentiment currently most closely resembles that of the Feb and Oct 2018 declines. The major difference was the Mar retest and subsequent ATH vs lower lows after the Nov lows.

Update. ST sentiment turned negative Thur but bounced back to neutral Fri.

Update. ST/INT sentiment remains largely positive and may limit losses.
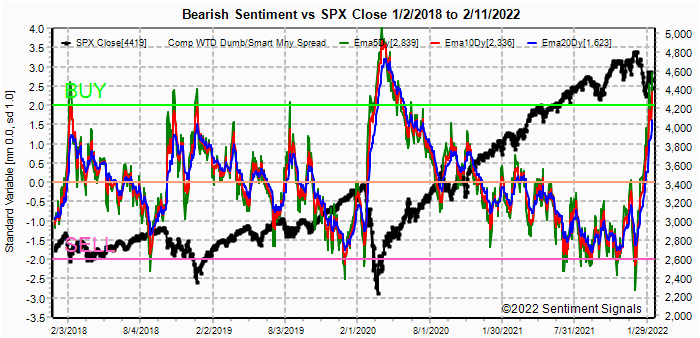
Update ema. Sentiment is starting to look a lot like mid-2020, where a sharp decline and retest was followed by a move to ATHs over the next few months.


Update. HUI prices seem to be stuck in the 240-260+ area, while sentiment is largely unchanged. Tech/Other looks a possible positive influence from China's SSEC.

II. Dumb Money/Smart Money Indicators
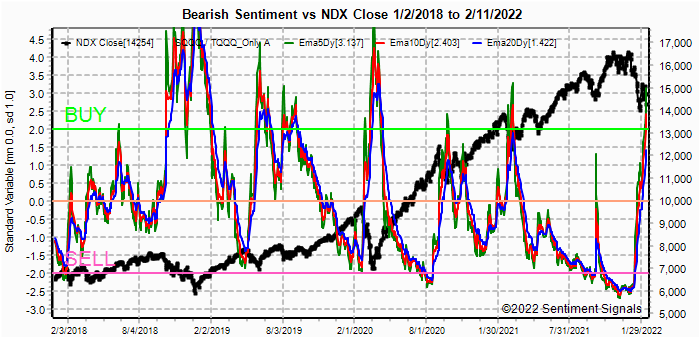
This is a new hybrid option/ETF Dumb Money/Smart Money Indicator as a INT/LT term (outlook 2-6 mns) bearish sentiment indicator. The use of ETFs increases the duration (term).
Update. Somewhat similar to the INT/LT Composite, where the current rise is about the same as Feb and Oct 2018, but here we see a stark difference with the sharp decline in bearish sentiment before the Dec 2018 meltdown vs the gradual decline after Feb and Dec 2018 before the rally to new ATHs.


I will admit after looking at this, I had to check some raw data (SMA) and you can see below the same info you see in Stockcharts for Price x Volume.

III. Options Open Interest
Using Thur closing OI, remember that further out time frames are more likely to change over time, and that closing prices are more likely to be effected. Delta hedging may occur as reinforcement, negative when put support is broken or positive when call resistance is exceeded. This week I will look out thru Feb 18.
With Fri close at SPX 4419, options OI for Mon is small, but has strong put support in the 4300 area and first call resistance at 4600. Below 4420, there is little support until 4350.


IV. Technical / Other
This week I wanted to take a brief look at the relationship between Chinas SSEC and gold. I had mentioned the strong correlation several times and tried to add it to the data mining DB, but differences in holidays made matching dates too difficult. China has been cutting rates and this has helped both stocks and gold.

Conclusions. The recent rise in bearish sentiment for many of the INT indicators (mainly hedge spread and SPX ETFs) has forced me to raise my lower target price range to 4300-4400 with 4350 most likely unless Russia invades Ukraine then it becomes 4100-4200. There is no immediate indication of a sharp turn next week although 4350-4500 is the most likely range. The most likely source of a sharp turn around is a diplomatic solution to Ukraine, and a quiet week will support that outcome.
Weekly Trade Alert. I think this is the first week this year where I have no trade alerts. Any bottom over the next two weeks will likely be significant for a swing trade. Updates @mrktsignals.
Investment Diary, Indicator Primer,
update 2021.07.xx Data Mining Indicators - Update, Summer 2021 (in progress),
update 2020.02.07 Data Mining Indicators,
update 2019.04.27 Stock Buybacks,
update 2018.03.28 Dumb Money/Smart Money Indicators
Article Index 2019 by Topic, completed thru EOY 2020.02.04
Article Index 2018 by Topic
Article Index 2017 by Topic
Article Index 2016 by Topic
Long term forecasts
© 2022 SentimentSignals.blogspot.com
No comments:
Post a Comment