
My bias last week was for a basing period before a stronger rally but the SPX options OI turned out to be prophetic indicating that an early breakout over SPX 4450 would continue to 4550 mid-week with the Wed high at 4595 (62% retrace at 4590). The large Fri SPX call positions at 4400 (10k) and 4500 (12k) also warned of a late week reversal and Thur-Fri saw a pullback to a low Fri AM to 4450 before a 4500 close.
The stronger SPX rally and sharp reversal at the 62% retracement of the Jan decline increases the potential of a more complex bottom over the month of Feb. One possibiliy is a series of double tops and bottoms (in EW b-waves). An example, is a retest of Fri lows at SPX 4450 beore a rally back to retest the weekly highs (SPX 4580-90) later in the week, then a decline into mid-late Feb to SPX 4200-300. This weeks SPX options OI seems to support this outlook ST. The strong bearish sentiment, especially Hedge Spread (ST/INT) and SPX ETFs (INT/LT) indicates that declines are likely to be short lived.
There is also a major Bradley turn date late Mar that could be the next significant high. For the last couple of years the EU has been leading the US in covid development by 4-6 weeks and have recently seen a number of countries lifting all restrictions and the US may follow, creating some stock market euphoria. As an outlook of what may follow, M.Hulbert compared the Spanish flu pandemic of 1918 to covid 2020, interestingly US stock markets (DJIA) rallied strongly for the first two years of the Spanish flu then declined by 50% the next two years as the Spanish flu receded. But, next the roaring twenties.
I. Sentiment Indicators
The INT/LT Composite indicator (outlook 3 to 6+ months) has three separate
components. 1st is the SPX and ETF put-call indicators (30%), 2nd the SPX 2X ETF INT
ratio (40%), and 3rd a volatility indicator (30%) which combines the options
volatility ratio of the ST SPX (VIX) to the ST VIX (VVIX) with the VXX $ volume.
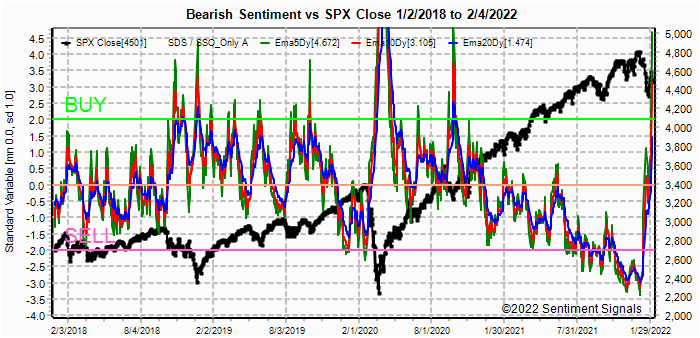
Update. Bearish sentiment continues to rise, especially SPX ETFs, increasing the probability of an eventual retest of the ATHs.

Update. ST sentiment fell sharply, but remains positive. A similar pattern to Dec 2021 could mean a retest of the Jan lows on a spike below neutral.

Update. Bearish sentiment remains very strong from the Hedge Spread and SPX ETFs.

Update. The last time sentiment was this strong was July 2020, which was followed by a two month rally to new highs.

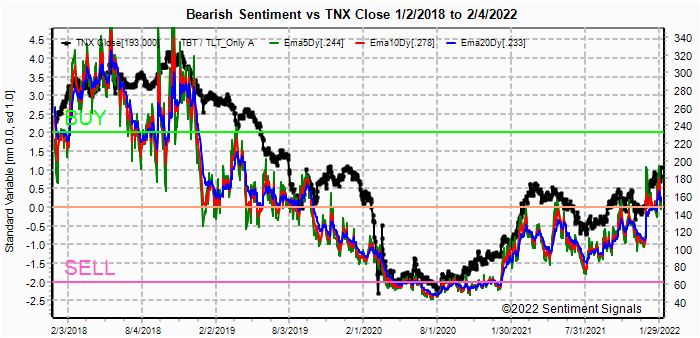
Update. HUI prices seem to be stalling in the low 240s while sentiment weakens.

II. Dumb Money/Smart Money Indicators
This is a new hybrid option/ETF Dumb Money/Smart Money Indicator as a INT/LT term (outlook 2-6 mns) bearish sentiment indicator. The use of ETFs increases the duration (term).
Update. Sentiment rose sharply, with ST (grn) moving into Buy region, nearing the levels seen in Oct 2018.


III. Options Open Interest
Using Thur closing OI, remember that further out time frames are more likely to change over time, and that closing prices are more likely to be effected. Delta hedging may occur as reinforcement, negative when put support is broken or positive when call resistance is exceeded. This week I will look out thru July 16. Also, this week includes a look at the GDX for Dec exp.
With Fri close at SPX 4501, options OI for Mon is very small with large call OI at 4800. SPX moderate put support is 4450 and call resistance is 4600. A decline to 4450 should reverse toward 4500 by the close.


For opt exp Fri PM moderate OI and a large call OI at 4500 indicates that a close at/below 4500 is likely.

Conclusions. All indications are that the covid pandemic of the last two years is coming to an end and will result in fully opened economy. This obviously good for main street, but will it be good for Wall Street? The world governments approached the pandemic with both shock and awe by Fed and Congress that rivalled the US invasion of Iraq in 2003, and how did that turn out? The Fed is being forced to face its largess by decades high inflation inflation rates and as a result must raise interest rates. Congress has been slow to address the record deficits per capita in real terms, and rising interest rates could push them toward the 1960s result of the combined war efforts in WW2 and Korea that resulted in 90% maximum income tax rates. If the results of the Spanish flu are any guideline, we may face a very tough couple of years, then it becomes "inflate or die".
Weekly Trade Alert. Any weakness early in the week (SPX 4450 poss) should be bought with a potential mid-week retest of last weeks high (4570-90) before a late week fade (4500 possible). Updates @mrktsignals.
Investment Diary, Indicator Primer,
update 2021.07.xx Data Mining Indicators - Update, Summer 2021 (in progress),
update 2020.02.07 Data Mining Indicators,
update 2019.04.27 Stock Buybacks,
update 2018.03.28 Dumb Money/Smart Money Indicators
Article Index 2019 by Topic, completed thru EOY 2020.02.04
Article Index 2018 by Topic
Article Index 2017 by Topic
Article Index 2016 by Topic
Long term forecasts
© 2022 SentimentSignals.blogspot.com
No comments:
Post a Comment