
Last week I gave no specific guidance other than a likely range of SPX 4350-4500 with Mon starting off with a decline to 4365 before a sharp turn around into Wed to 4485 then likely Russia/Ukraine concerns over the three day weekend took the SPX back down to a low Fri of 4327.before closing at 4349. We may be seeing a "weekly war cycle" that lasts a couple of more weeks where optimism over a peaceful resolution early in the week gives way to fear of holding a long position over the weekend.
INT/LT sentiment has continued to rise while ST indicators are not yet supportive of a rally. More downside/consolidation early next week may begin a ST turn around. Next week I will take a closer look at the 2018 analog where high bearish sentiment resulted in a new ATH (as a b-wave) before a sharper decline. We may see something similar in 2022.
I. Sentiment Indicators
The INT/LT Composite indicator (outlook 3 to 6+ months) has three separate components. 1st is the SPX and ETF put-call indicators (30%), 2nd the SPX 2X ETF INT ratio (40%), and 3rd a volatility indicator (30%) which combines the options volatility ratio of the ST SPX (VIX) to the ST VIX (VVIX) with the VXX $ volume.
Update. Here, the INT/LT Composite has continued to climb, resulting in the highest bearish sentiment since Mar 2020 and led by the SPX ETFs.

Update. The ST Composite moved up sharply from neutral but remains well short of a Buy signal.

Update ema. Looking at the LT from 2018, the recent move in sentiment above the 2021 levels may just be a return to normal before the "negative real int rates" since Mar 2020. Here, looking at the comparison to 2018 mentioned last week Feb 2018 saw an increase from -1 to 4SD (+5), while Oct 2018 went from -1 to 3.5 SD (+4.5) and Jan 2022 only went from -3 to +1SD (+4), so the 2022 decline so far has been milder sentiment wise.


Update. The HUI seems to have broken out from the 240-260+ price range while sentiment has retreated, but this may only be temporary depending on how the Russia/Ukraine situation works out.

II. Dumb Money/Smart Money Indicators
This is a new hybrid option/ETF Dumb Money/Smart Money Indicator as a INT/LT term (outlook 2-6 mns) bearish sentiment indicator. The use of ETFs increases the duration (term).
Update. Starting a levels near those seen in Dec 2019, bearish sentiment is nearing that seen during the Mar 2020 crash.


The INT term NDX ST 3x ETFs (outlook 2 to 4 mns) bearish sentiment has increased by more than any decline since 2018 with the exception of Dec 2018.

III. Options Open Interest
Using Thur closing OI, remember that further out time frames are more likely to change over time, and that closing prices are more likely to be effected. Delta hedging may occur as reinforcement, negative when put support is broken or positive when call resistance is exceeded. This week I will look out thru Feb 25. Also, this week includes a look at the GDX and TLT for Mar exp.
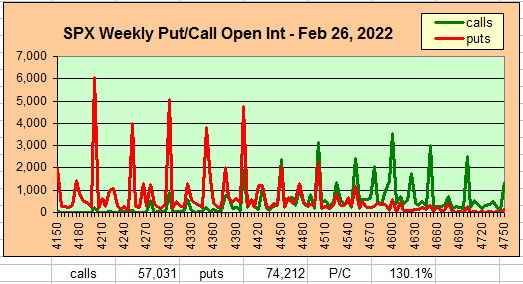
With Fri close at SPX 4349, options OI for Tue is small, but shows relative strong put support at 4300, 4350 and 4400 and call resistance at 4450. Any early weakness is likely to be reversed by the close with possible targets of 4350, 4375 then 4400+


For Mar 18PM opt exp, OI is small, but currently indicates a possible move to the 4525-75 area. Note FOMC meeting 15-16.
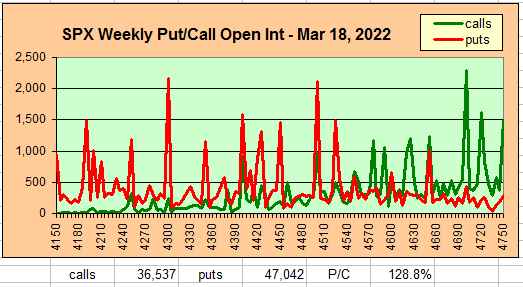
For Mar 31 EOQ large OI and P/C show strong put support at SPX 4525 where the consensus are expecting lower prices, while the contrary play is that there will be a positive response to the expected Fed's rate hike (possibly only .25% vs expt .5%). No call resistance until 4700.

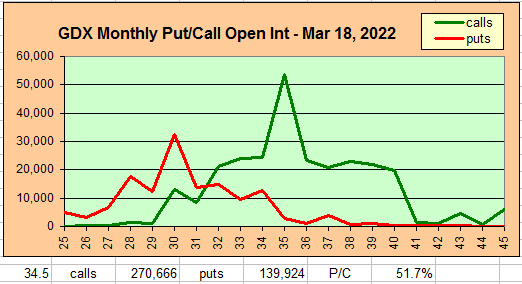
Using the GDX as a gold miner proxy closing at 34.5 (HUI 283), the gold miners P/C is very low and the expected range is GDX 30 (put support) to 35 (call resistance) and HUI 250 to 285.
Currently the TLT is 138 with the TNX at 1.93%, successful ST resolution to the Russia/Ujraine crisis could push TLT back to 143 (put support) or TNX 2.05% with call resistance at 145 or TNX 2.15%.

IV. Technical / Other - N/A
Conclusions. In the introduction, I mentioned a "weekly war cycle" with early strength (relief rally) followed by late week weakness, but the SPX options OI is showing that this is the consensus for options players, so the contrary play is to expect the opposite.
Weekly Trade Alert. Next week could go either way and possibly both. Weakness into Wed is likely to reverse by EOD Fri, while beginning strength may reverse into Wed then again reverse again into Fri with SPX 100 pt moves possible (roughly 4325-4425). Updates @mrktsignals.
Investment Diary, Indicator Primer,
update 2021.07.xx Data Mining Indicators - Update, Summer 2021 (in progress),
update 2020.02.07 Data Mining Indicators,
update 2019.04.27 Stock Buybacks,
update 2018.03.28 Dumb Money/Smart Money Indicators
Article Index 2019 by Topic, completed thru EOY 2020.02.04
Article Index 2018 by Topic
Article Index 2017 by Topic
Article Index 2016 by Topic
Long term forecasts
© 2022 SentimentSignals.blogspot.com
No comments:
Post a Comment