
So last week, I gave myself a B+ for market outlook as my primary outlook was for a downward bias with a wide trading range of SPX 4450 to 4350 and although the top tick was.4453 the bottom tick was 4222 (off by 100+). I did better for closing prices (Mon 4410, 4358, 4350, 4327, and Fr 4432). The outllok for "wild swings" due to the lack of capitulation was also spot on as every day showed at least one SPX 100+ pt move - a traders dream. Next week, unfortunately, is likely to be boring with a range more like SPX 4400-50, although SPX options OI does show the potential for a move to 4350 late in the week if there is not a strong breakout over 4450.
Bearish sentiment moved up sharply last week, and as posted in the Thur 10 AM update now supports a 200-400 pt SPX rally (4550-4750). Many EW analysts are looking for a lower low in the ST, but it seems unlikely due to the huge increase in hedging (Hedge Spread) unless Russia invades Ukraine soon.
A LT outlook for the ST/INT sentiment indicators for the SPX and the HUI is in the Tech/Other Section.
I. Sentiment Indicators
The INT/LT Composite indicator (outlook 3 to 6+ months) has three separate components. 1st is the SPX and ETF put-call indicators (30%), 2nd the SPX 2X ETF INT ratio (40%), and 3rd a volatility indicator (30%) which combines the options volatility ratio of the ST SPX (VIX) to the ST VIX (VVIX) with the VXX $ volume.
Update. The Jan decline has seen an overall sharp increase in bearish sentiment, but with the rise to just over neutral, the decline is likely only halfway over. Like the Oct-Dec 2018 decline, however, a retracement rally is likely over the next 1-2 months. April-May may be the next high risk period.


Update showing a breakdown of the NYDNV components as capitulation volume (grn) is still lagging.

Update. The ST/INT Composite shows very strong bearish sentiment that could result in a 70-90% retrace or more of the current decline.

Update EMA also showing very strong bearish sentiment for the ST/INT, see Tech/Other for INT/LT.


Update. The brief spike over HUI 260 was swiftly followed by a move below 240 Fri before a late recovery. Sentiment mostly unchanged. See Tech/Other for LT view.

II. Dumb Money/Smart Money Indicators
This is a new hybrid option/ETF Dumb Money/Smart Money Indicator as a INT/LT term (outlook 2-6 mns) bearish sentiment indicator. The use of ETFs increases the duration (term).
Update. The DM/SM Indicator moved up sharply last week, indicating that at least a temporary bottom is in place, but the current levels are more like the Oct-Dec 2018 period where the current decline is only stage 1 of a multi-stage decline and not likely to produce new ATHs.


III. Options Open Interest
Using Thur closing OI, remember that further out time frames are more likely to change over time, and that closing prices are more likely to be effected. Delta hedging may occur as reinforcement, negative when put support is broken or positive when call resistance is exceeded. This week I will look out thru Feb 4.
With Fri close at SPX 4432, options OI for Mon (Jan EOM) is very large with put support at 4400 and call resistance at 4450 and a slight upward bias (P/C) between 4425-40. Possible break from last weeks wild swings.


IV. Technical / Other
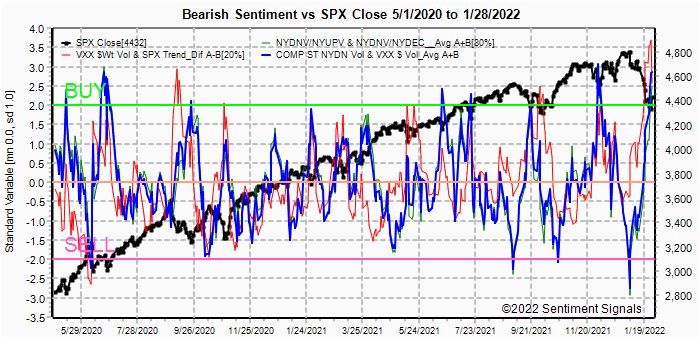
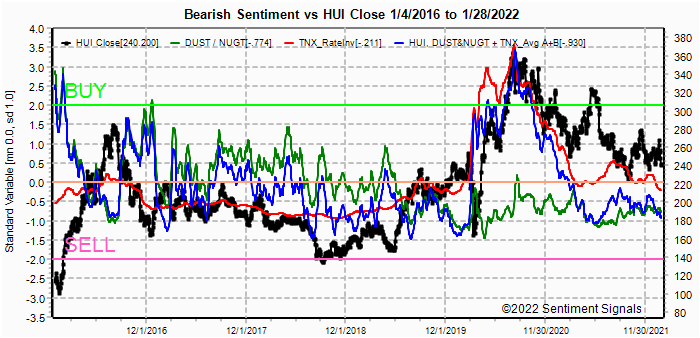
This week I want to look at some of the longer term intervals for the ST/INT Composites from Jan 2018, and for the HUI back to Jan 2016.
First the ST Composite (NYDNV & VXX), the fact that VXX $ Vol is leading this indicator is somewhat worrisome INT due to comparisons to Feb 2018 (SPX retest later), Oct 2018 (lower later) and Mar 2020 (continued decline).

Next the Hedge Spread, here the strongest bearish sentiment since early 2020 is still much lower than prior bull phases and unlikely to support more than a retrace rally.

Next the ST/INT Composite where sentiment is similar to the above and unlikely to support a breakout to the SPX 5k-6k area.

And finally the HUI back to 2016. Here, we see that most of the rally since nid-2019 has been due to lower int rates (TNX RateInv) and lately higher inflation, but higher rates and lower inflation may take HUI prices to 100-140 to take ETF sentiment (grn) to the Buy level.
Conclusions. I had been looking for an SPX 15-18% decline in 2022 Q1, but it looks like an SPX 12% and NDX 18% decline will have to do for now. Mon spike low ar SPX 4222 was likely due to market sell orders by the pesky Robinhood traders and I was waiting to see if a lower close last week would be used to pressure nervous 401K holders by confirming a negative "January effect" (first & last week, overall), but the Fri close over SPX 4400 can be interpreted as a positive. This likely means a delay in the 401K selling until lower levels (likely -20%+).
Weekly Trade Alert. A V-bottom could produce a rally to SPX 4550 next week, but I doubt that is the case. Updates @mrktsignals.
Investment Diary, Indicator Primer,
update 2021.07.xx Data Mining Indicators - Update, Summer 2021 (in progress),
update 2020.02.07 Data Mining Indicators,
update 2019.04.27 Stock Buybacks,
update 2018.03.28 Dumb Money/Smart Money Indicators
Article Index 2019 by Topic, completed thru EOY 2020.02.04
Article Index 2018 by Topic
Article Index 2017 by Topic
Article Index 2016 by Topic
Long term forecasts
© 2022 SentimentSignals.blogspot.com
No comments:
Post a Comment