Sunday, February 26, 2017

Not There Yet

Signs are beginning to mount that an important top is nearing.  As mentioned in the January 15 post, much of the ammunition for the current rally is the anticipation of new tax and spending policies.  However, as a non-politician Trump and his believers have underestimated the time for government actions.  The latest figures are for tax reform by August and infrastructure spending by 2018. This is reflected in two of the MISC indicators (not in composite) that are mentioned later.

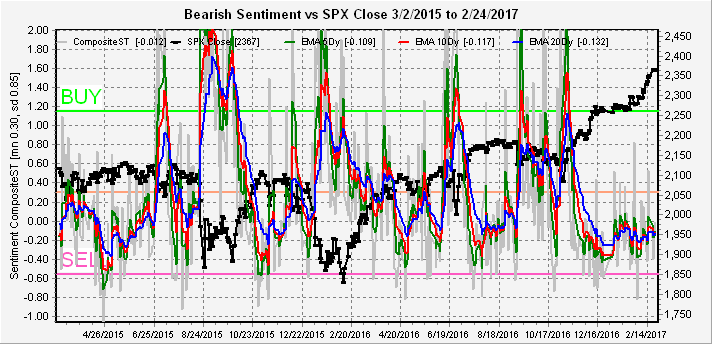
The overall Indicator Scoreboard is maintaining its position near the SELL range.


The Short Term Indicator (VXX $ volume and Smart Beta P/C) continues to be range bound in the moderately negative sentiment range.


The MISC indicators that I mentioned several weeks ago, as not confirming a potential top, are now moving closer to the SELL region.  The VIX P/C and TRIN charts are shown below.  The TRIN (showing net adv issues/net volume) has risen to the highest level since last Sept, indicating that supporting volume is drying up as prices advance.


Interest rates fell (TNX) even as sentiment remained mildly bearish, probably due to news of the delayed Trump stimulus.


Finally, the gold stock sentiment (HUI) remains in the SELL region as mining stocks posted a modest retreat.


Conclusion.  At least one well known EW analyst, Pretzel Logic, feels that the 5th wave may be complete. This may be so, but sentiment indicators do not indicate risk of strong downside just yet, mid-March is appearing more likely to be the point of maximum risk.

Weekly Trade Alert.  None for this week.  Updates @mrktsignals.

Sunday, February 19, 2017

A Top Could Come at Any Time

Last weeks forecast of an up week for option expiration proved correct although the forecast of SPX 2330-50 was beaten by one point.  Short term the outlook is more cloudy.  With so many convinced of SPX 2400 or 2500 immediately ahead, a turn down could occur any day, so all I can say is that a significant top should occur in the next two to four weeks.

Looking at the indicators, overall Indicator Scoreboard saw a sharp spike downward to the fourth lowest level of the last two years on the back of capitulation in the Put/Call ratios.  This may indicate a short term pullback next week before a rally to a final high in March.


Looking at the Indicator Scoreboard long term, current optimism is a near mirror image of the pessimism resulting from the January 2016 decline.


The Short Term Indicator (VXX $ volume and Smart Beta P/C) is little changed showing lack of strong downward pressure.


Bearish sentiment for bonds (TNX) continued to drop longer term, even as rates consolidated in the middle of the recent trading range.


Finally, the gold stock sentiment (HUI) remains firmly in the SELL region as the HUI seems to be consolidating lower.


Conclusion.  As I mentioned a couple of weeks ago, a move toward SPX 2400 is possible, but sentiment has reached such an extreme that I would not be surprised by a premature failure.

Weekly Trade Alert.  None for this week.  Updates @mrktsignals.

Sunday, February 12, 2017

Trumpmania Continues

Sometimes sentiment does not seem to matter, at least until it does, and now seems to be one of those times.  On Thurs @mrktsignals, I indicated that the rally was expected to continue into next week with the next target SPX 2320 and 2319 was hit Friday.  Since I see no sign of an imminent intermediate decline, I can only point to the SPX rising wedge in the SPX since early 2016 with a top at 2050 and a low at 1810.  In EW terms wave 1 was 300 SPX pts and with the current wave 5 starting at the pre-election low of SPX 2084, then a top may be 2390 meeting the rising channel around April.

The overall Indicator Scoreboard remains near an intermediate term SELL level which tells me that the top will be followed by a significant decline.


The Short Term Indicator (VXX $ volume and Smart Beta P/C) remains at a very low level, but as yet has not seen the spike low to the SELL level that was seen preceding recent significant declines.


There was not a lot of change to either the VIX P/C or TRIN charts that were shown for the past couple of weeks.  SPX and NDX ETF bearish sentiment remains at lows of the past two years.

Bearish sentiment rose slightly last week for bonds (TNX) as interest rates rose slightly.


Finally, for gold stocks (HUI), the prices have now exceeded the Jan 2015 highs, but sentiment has moved firmly into the sell level.  I have noticed that almost on a daily level that gold prices have been moving inversely to interest rates and will probably remain the driver of any short term price movement.


Conclusion.  The big news story is Trump's announcement of a significant tax plan over the next one to two weeks.  This is likely to be a "sell the news event" for a short term pullback.  We could see SPX 2330-50 when announced.  Can the significance of Trump and Putin both being billionaires be more than a coincidence? Several years ago Russia started a 15% flat tax rate, but it did little to stimulate markets or the economy.

Weekly Trade Alert.  No specific shorting targets, last weeks update on Twitter cancelled previous trade guideline.  Updates @mrktsignals.

Sunday, February 5, 2017

Meandering Along

Last week I indicated that at least a short term pullback was likely in the SPX as the overall Indicator Scoreboard reached the SELL level, but that I was becoming less bearish for a strong pullback immediately. For the week, the SPX dropped from 2300 to 2267, then closed at 2297.  More upside is likely early in the week, probably SPX 2305-20, before a stronger pullback targeting 2230.  Using the same indicators as last week, the current topping pattern is becoming more like the Apr-June 2015 period and appears to be extending into March of 2017.

The overall Indicator Scoreboard spiked somewhat higher on the basis of higher put/call ratios, not unlike the first half of 2015.


The Short Term Indicator (VXX $ volume and Smart Beta P/C), however, moved lower similar to the May 2015 high, leading credence to a stronger pullback than last week from next week's high.


The TRIN (as a measure of net adv issues to net volume) continues to move higher with lower supporting volume and is also in a similar position as the May 2015 top.


The VIX P/C saw a fairly sharp spike lower during the week before moving higher at the end of the week, again not unlike the period immediately preceding the May 2015 top.


Interest rates (TNX) continue to consolidate in a narrow range around the 2.5% breakout zone while bearish sentiment remains at fairly low levels.


The gold stocks (HUI) did make a slightly higher high last week, but both the 5 and 10 day EMAs dropped down to the SELL level.


Conclusion. I was expecting more immediate downside as a result of the positive "January effect", but both the pullback early in the week and the consolidation period in bonds indicates a more lengthy topping process.

Weekly Trade Alert.  It's becoming more difficult to come up with specific targets, but I will be looking for SPX 2305-10 as a shorting zone with stops above 2320.  Updates @mrktsignals.

Sunday, January 29, 2017

Nearing the Edge of the Cliff

Several weeks ago when I pointed out the possible significance of a false timing signal from the so called "January effect", I expected somewhat more volatility that a fifty point SPX trading range for six weeks.  Now the 1% breakout last week has the bulls convinced that Nirvana is just around the corner.  This is most evident in the bonds (TNX) and gold stocks (HUI) where sentiment is nearing a SELL even though there has not even been a breakout.

For stocks (SPX), the story is much the same with low bearish sentiment remaining and no apparent reason for things not to continue so.  My reasoning remains that higher rates will be the key to bring down the house of cards for a broad range of asset classes.

Now looking at the indicators, the overall Indicator Scoreboard has now fallen back to the SELL level, indicating that at least a short term pullback is likely to start next week, but does not rule out a continuation top similar to the first half of 2015 or mid 2016.


The Short Term Indicator (VXX $ volume and Smart Beta P/C) has also turned lower but has still failed to reach the extremes seen before the Aug 2015 and Jan 2016 for the very short term.


If I seem to be somewhat more conservatively bearish, I will show two of the MISC indicators that do not seem to be indicating a short term top yet. The first is the TRIN (essentially a measure of net adv issues to net volume) which usually shows lower supporting volume or higher ratios as seen in Aug 2015 or late 2016.


The second indicator is the VIX P/C, where lower levels are typically seen before a significant selloff.


Moving on to bonds (TNX), investors seem to be flocking into the bond ETFs as rates have stabilized around 2.5%.  Interest rates have been somewhat weaker than I expected to date, but a breakout to the upside still seems more likely.


Finally, the gold stocks (HUI) shows an even sharper drop in bearish sentiment even as the HUI has stalled out around the 200 level.  Compared to bonds gold stocks seem to be betting on higher growth and more inflation, while bonds seem to be expecting lower growth and less inflation.


Conclusion.  The end of January has produced a positive result as expected, but some of the indicators are not as extreme as expected for a major top.  I will be watching bonds (TNX) very closely as a breakout over the 2.6% level may be required for a major selloff to start.

Weekly Trade Alert.  I did call off all trades last week via @mrktsignals due to pre-market levels and EOM timing considerations.  This week there are no clear shorting levels, so I will probably stand pat with any changes posted on Twitter.

Sunday, January 22, 2017

Game Time

The SPX continued its sideways dance last week with the NDX streaming ahead on the back of Netflix, while the DJIA faltered somewhat.  As most of you this Sunday afternoon, most of my attention is focused on football.  So this weekends post will be brief with little change in outlook from last week.

Looking at the overall Indicator Scoreboard, bearishness remains at low levels after reaching a momentum extreme low.  An advance toward the mean is not unlikely before a correction begins.


The Short Term Indicator (VXX $ volume and Smart Beta P/C) is in a similar position.


Looking at the SPX 3x ETFs SPXU/UPRO shows that bearishness is becoming more compressed to the SELL side, leaving little hope for those expecting a breakout rally at this time.


The strongest index, the NDX, show bearish sentiment about as low as it can get using the 3x ETFs.


Sentiment for bonds (TNX) using TBT/TLT showed a surprising drop in bearish sentiment even as rates rallied back to the 2.5% level.  Not what you want to see if you are a bond bull.


The gold miners (HUI) continue to bet on the reflation trade at the same time as the HUI stalls out at the same level as the early 2015 rally top.  Sentiment for bonds and gold indicate the advance in rates with continued pressure on gold is just ahead.


Conclusion.  Not much change from last week.  All signs are pointing to tops in January for a variety of assets, as I continue to believe that higher rates are the biggest concern going forward for most of 2017.

Weekly Trade Alert.  We did not get the expected move last week for the SPX to 2285-90.  So I am moving my timing top to the EOM.  Short at 2285-90 with a stop at 2300.  Updates will be posted @mrktsignals if a trade is recommended or any change in outlook is necessary.

Sunday, January 15, 2017

Bull Market or Just Bull

The market measured by the SPX has managed to gain a total of five points over the last month from 2278 when my Short Term Indicator joined the overall Indicator Scoreboard on December 11 pointing to an intermediate term top.  Last week I pointed that January would probably be manipulated in order to show a positive "January effect", so far so good.  One indicator that acts like the Hindenburg omen is a surge in the volume of VIX calls over 500k per day.  In 2015, there two such days in November and 5 in mid-December, the past two months saw two in December and four last week.  There is no specific timing involved, but a top is likely between options expiration and the EOM, then a significant decline to SPX 2100 or lower.  The trading range last week saw little change in sentiment except gold stocks.

The overall Indicator Scoreboard saw a very small uptick in bearish sentiment, but no change in overall posture.


The Short Term Indicator (VXX $ volume and Smart Beta P/C) is in a similar trending up, but bearish position.


Price and sentiment are relatively unchanged for bonds (TNX).


Sentiment for the gold miners (HUI) has dropped to an almost bearish low extreme although still a similar pattern to the early 2015 period.


Conclusion.  Although I still think we may have the "reflation rally" that everyone has been looking for the last three years, economic patterns show a clear lag between policy inception and effectiveness.  Typically a 6 to 12 month period is necessary to develop policy then another 12 to 18 months to see the full effect.  This means a low could be see by mid 2018 and a high by 2020.  If you think the stock market sees all, just remember the housing crisis.

Weekly Trade Alert.  A significant top is likely soon.  Look for the SPX to pop to 2285-90 next week with a short at 2285 and a stop at 2300.  Updates will be posted @mrktsignals if a trade is recommended or any change in outlook is necessary.