I. Sentiment Indicators
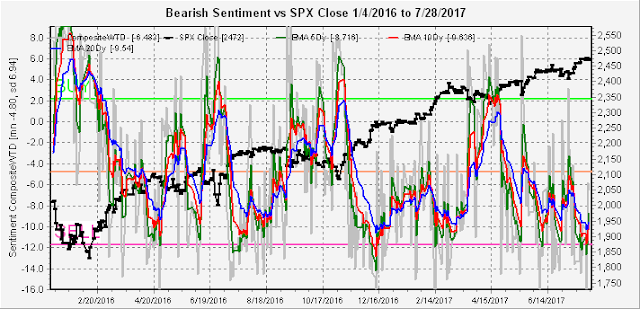
The overall Indicator Scoreboard rebounded slightly with Thursday's mini flash crash, but remains in the near SELL area.
The Short Term Indicator (VXX $ volume and Smart Beta P/C) dropped to the SELL level Tues as posted on Twitter, but I rated this as a warning only since most of the decline was due to very low VXX $ volume as shown below.
Based on what appears to be a washout of VXX volume, the lows are probably in for the VIX (8.84) and VXX volume.
However, the Smart Beta P/C still looks like it should go lower for a top.
The NDX/QQQ ETFs nearly reached my target at NDX 6000 (5995) with sentiment falling to recent lows before the last two day selloff that has given only a weak BUY. It is hard to tell if the highs are now in.
Bearish sentiment for bonds (TNX) moved toward neutral with the sideways movement likely to continue.
Gold stocks (HUI) are pushing up against the upper bounds of the recent trading range at the 200 SMA and it is surprising that given the weakness of the US $ that gold stocks have not been stronger.
II. Options Open Interest
This week I am going to look at the weekly setup through to the Aug 18 expiration. For Aug 4, normally prices should drop below the SPY 246 level, but since 246 was successfully tested with a rebound to 247 to close the week, the more likely outcome seems to be a tight range around 247 unless 248 is exceeded.
For Aug 11, this week shows a possible range of SPY 246 to 248 with strong resistance over 248.
For Aug 18, huge levels of put support have built up over the past couple of weeks in the 243 to 247 area that seem to indicate the best chance for a push to 248 or higher as long as the 243 support level holds.
Looking ahead to Sept 15, the put levels at 240 have doubled while calls have remained constant, reducing the chance for a decline below 240.
Conclusions. A top is approaching but it hard to tell when. Last weeks minor pullback increased bearishness that may elevate markets for another two or three weeks. Another factor is the US $ which seems to be supporting the DJIA even as other sectors struggle. An analyst at B of A discusses his outlook of the US $ influence at ZH last week.
Weekly Trade Alert. None. More consolidation short term seems likely. Updates @mrktsignals.
Article Index 2017 by Topic
Article Index 2016 by Topic
© 2017 SentimentSignals.blogspot.com


No comments:
Post a Comment