
Last weeks stock market followed "the Big Sideways" outlook to a tea as the SPX tested the high of the range given several weeks ago of 3650-3950 with a Mon top almost exactly3950 before dropping to a lower low than the previous week at 3885 causing the EW analysts to flip/flop once again calling the "5 wave" decline the beginning of a much larger decline. There are some indications in the SPX options OI of a move up (3930-50) before resumption of the decline, possibly causing the same EW analysts to flip/flop once again.
I am still waiting for the snow and ice to melt before going anywhere, but one good side effects of this pandemic was storing extra food and water in case of shortages so most hardships were avoided. In the progressive state of Texas, however, who would ever expect a cold wave that would knock power for a week. So much for going green.
This week will continue looking at some of the new data mining composites in Tech/Other. In case you wonder where I going with this, I hope to replace the EMA indicators by the summer and these "new" indicators are a first look at possible replacements. Next week will include ETF indicators for the SPX and NDX.
I. Sentiment Indicators
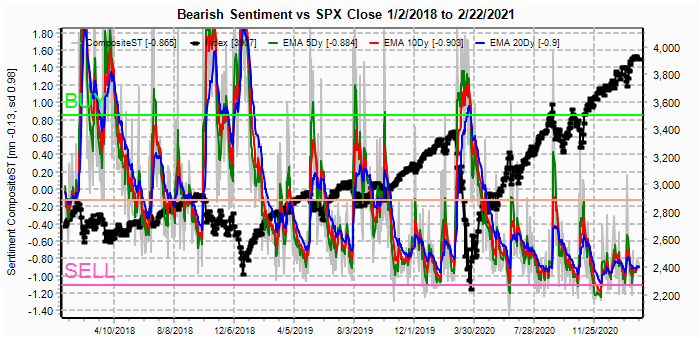
The overall Indicator Scoreboard (INT term, outlook two to four months) bearish sentiment dropped sharply last week even as prices stalled out. The majority still seem to be looking for a "melt up" before a "melt down".

The INT view of the Short Term Indicator (VXX $ volume and Smart Beta P/C [ETF Puts/Equity Calls], outlook two to four months) bearish sentiment remains in a tight range near historical lows.
Bonds (TNX). Bearish sentiment in bonds continues to follow rates higher with little panic even as the TNX reached 1.35% last week. A move to the 3% level looks likely before reaching the Buy level. A stall around the 2% level is possible as this would likely be the catalyst for a 10%+ correction in the SPX.

For the INT outlook with LT still negative, the gold miners (HUI) bearish sentiment remains muted even with the breakdown to new lows. As I have been warning for months, the gold bugs assumption that a pickup in inflation would power gold to 3000 and PMs to the sky was flawed, with a sell off more likely due to the resulting higher interest rates.

II. Dumb Money/Smart Money Indicators
The option-based Dumb Money/Smart Money Indicator as short/INT term (outlook 2 to 4 mns/weeks) bearish sentiment retreated sharply last week, giving up about half the gains from the late Jan decline.

And the sister options Hedge Ratio bearish sentiment declined even more sharply, now close to the levels seen before the late Jan decline.

III. Options Open Interest
Using Thur closing OI, remember that further out time frames are more likely to change over time, and that closing prices are more likely to be effected. Delta hedging may occur as reinforcement, negative when put support is broken or positive when call resistance is exceeded. This week I will look out thru Feb 26 and EOM Mar. Also, this week includes a look at the GDX & TLT for Mar exp.
With Fri close at SPX 3907, options OI for Mon are very light with only small call resistance at 3950 and first significant put support at 3750.

Wed has similar size OI where SPX shows small support up to 3925 and resistance at 3950.

For Fri EOM, we have large OI with SPX showing strong support at 3850 and strong resistance at 3925 in between is a "no man's land" where straddles are neutral. Two weeks ago I pointed out that the data mining indicators showed low put-call volume was generally bullish and may carry over to OI and the next week was bullish, so we may see an early week retest of 3950 before weakness later.

For Mar EOM, high call OI at 3875 and 3900 may indicate weakness into late Mar.

Using the GDX as a gold miner proxy closing at 32.7, as I have been warning the lack of put support below 34 and high call resistance above 35 would likely lead to weakness.

Currently the TLT is 143.7 with the TNX at 1.35%, TLT is down 4% from last Fri level of 149 or about the same as a drop in SPX from 3950 to 3800. I probably should have been looking at the EOQ as the "smart money" puts were hiding in Mar, indicating a drop toward 140.

IV. Technical / Other
This week I want to take a look at a potential replacement for my standard INT and ST composites. For the INT composite I started with the VIX Buy/Sell and Equity P-C indicators, but the volatility in the Equity P-C was not consistent with an INT composite. One of the indicators I referred to in my LT forecasts had been the $NYUPV/$NYDNV using the idea that volume led price with the potential for a 2007-08 setup. As you can see below a sharp drop in relative up volume typically precedes INT tops, so I decided to use a simpler approach and use SPX volume. The result was promising as seen below using equal wts, but still is too volaile.


For the next step I reduced the Equity P-C wt and increased the SPX vol wt which produced a more reasonable output and also increased the "fit" using the correlation (R).

For the ST composite I have only looked at the ETF and SPX calls and puts from the Composite Put-Call indicator using equal wts. Comparing the results of the INT and ST indicators, the conclusion is that the INT composite is showing a setup for something bigger in time and/or price than the corrections seen over the last three years, but the ST composite is showing that the setup is not yet complete.

Conclusions. Marking time seems to be the most appropriate expression for the current state of the stock market. Interest rates, however, have decidedly taken a turn higher which is pressuring the PM stocks. For the stock market, modestly higher rates can be a positive when an improving outlook for the economy increases the prospects for cyclical stocks (DJIA), but may pressure high growth stocks with low yields (NDX). At some point (likely TNX between 1.5% to 2%) comparison to the dividend yield, or as some prefer, the earnings yield, reduces the advantage for stocks and an asset allocation back to bonds occurs. This could continue into the summer with a potential range of SPX 3650-950. One EW analyst that shares the same outlook is OntheMoneyUK.
Weekly Trade Alert. SPX options OI indicates early week strength is possible targeting 3930-50 while a decline is likely to 3875-900 by Fri. Updates @mrktsignals.
Investment Diary, Indicator Primer,
update 2020.02.07 Data Mining Indicators,
update 2019.04.27 Stock Buybacks,
update 2018.03.28 Dumb Money/Smart Money Indicators
Article Index 2019 by Topic, completed thru EOY 2020.02.04
Article Index 2018 by Topic
Article Index 2017 by Topic
Article Index 2016 by Topic
Long term forecasts
© 2021 SentimentSignals.blogspot.com
Pattern suggests that one more high may still come before a larger decline. Irrespective, we see minimum 3400 in April.
ReplyDelete