
A strong start to the week was expected last week with favorable inflation (CPI), but was much stronger than expected with an SPX 100 pt romp to 4500 on Tue. The late pullback never materialized with the rest of the week spent bouncing around 4500. Forgive last weeks double negative which should have said "Don't be surprised if the SPX fills the gap at 4600 by Dec/Jan". A lower gap fill at SPX 4400 still looks more likely first, however. Oil and bonds continued to support the SPX with rates remaining in a tight range around 4.5% and oil dropping below $75/bbl before a late recovery.
Overall sentiment is supportive of a cyclical recovery in 2024 (stronger GDP and higher int rates) with large bearish sentiment for the DJIA (COT) and low bearish sentiment for the NDX (ETFs and options) and bonds (TBT/TLT). In addition the Teflon man (Trump) is looking more likely to resume the presidency and there is talk already beginning to extend (or make permanent) the Tax Cuts and Jobs Act of 2019 set to expire in 2025 which will increase the deficit and pressure bonds even more.
I. Sentiment Indicators
The INT/LT Composite indicator (outlook 3 to 6+ months) has three separate components. Starting Aug 26, 2023 SPX options are removed due to extreme 0DTE volume distortions. New weights are ETF put-call indicator (30%), SPX 2X ETF INT ratio (40%), and 3rd a volatility indicator (30%) which combines the options volatility spread of the ST SPX (VIX) to the ST VIX (VVIX) with the UVXY $ volume.
Update Alt. Bearish sentiment declined to neutral.


Update. Bearish sentiment fell during the week but bounced to end above neutral.


Update EMA. Bearish sentiment fell sharply last week with a sharp drop in hedging to about the weak Sell level.


Update. Bearish sentiment fell below neutral as the Hui remains in a tight range around 220.

II. Dumb Money/Smart Money Indicators
This is a new hybrid option/ETF Dumb Money/Smart Money Indicator as a INT/LT term (outlook 2-6 mns) bearish sentiment indicator. The use of ETFs increases the duration (term).
Update. Bearish sentiment fell sharply to the weak Sell level.


For the SPX, I am switching to hybrid 2X ETFs plus SPX options. Taking a look at the INT term composite (outlook 2 to 4 mns), bearish sentiment remains above neutral.

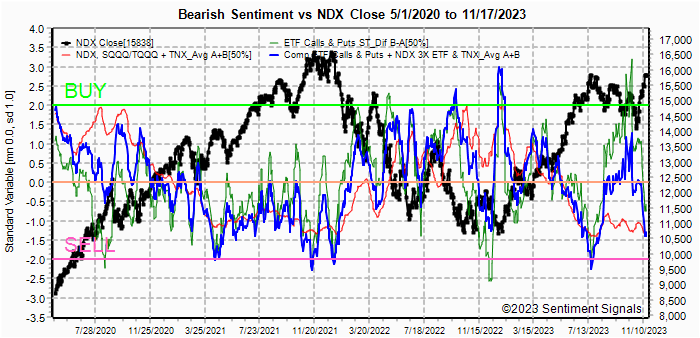
Bearish sentiment has fallen sharply to below the weak Sell based on weaker NDX ETF and ETF option sentiment pointing to a possible Black Friday disappointment.
Bearish sentiment for SPX is more bullish than for NDX and now at neutral.

III. Options Open Interest
Using Thur closing OI, remember that further out time frames are more likely to change over time, and that closing prices are more likely to be effected. Delta hedging may occur as reinforcement, negative when put support is broken or positive when call resistance is exceeded. This week I will look out thru Nov 18 & EOM. A text overlay is used for extreme OI to improve readability, P/C is not changed. Also, this week includes a look at the GDX for Dec exp. A new addition is added for OI $ amounts with breakeven pts (BE) where call & put $ amounts cross.
With Fri close at SPX 4515, options OI for Mon is moderate with put support at 4450 and call resistance at 4480.


For EOM strong SPX OI shows call resistance down to the 4400 level and lower.

Using the GDX as a gold miner proxy closing at 28.4, moderate put support at current levels may keep prices in a tight range.

Currently the TLT is 90 with the TNX at 4.44%, sentiment is somewhat reversed with calls at lower prices and puts above, but BE at current levels may also keep prices in a tight range.

IV. Technical / Other
The following uses barcharts.com as a source and discusses S&P futures (ES) as a third venue of stock sentiment in addition to options and ETFs. The non-commercial/commercial spread represents a LT bearish sentiment (dumb money/smart money) indicator. As explained in investopedia, commercial investors (red) are institutions and are smart money, while non-commercials (green) are speculators such as hedge funds and are dumb money. Here is the current barchart graph for the S&P 500 (top) and trader positions (1st bot) with positives as net longs and negatives as net shorts. Bearish sentiment is represented by the spread and is positive if red > green (Buy) and negative if green > red (Sell). ES (SPX) sentiment is neutral at + .25 SD, NQ (NDX) is Neutral at +0 SD, YM (DJIA) is a strong Buy at +2.5 SD, Dow theory may support DJIA thru EOY.
Click dropdown list to select from the following options:
Tech / Other History2023
2022
Other Indicators
Conclusions. I was one of the few calling for higher prices from
the Oct lows, but the vertical nature of the rally was surprising, likely due to
the blindsiding of the bears. Currently there is no indication of an
immediate reversal, other than a ST pullback. My LT outlook remains for a
major top late 2024, possibly near the Nov election..
Weekly Trade Alert. Last week never saw the expected pullback as
prices were supported by lower int rates and oil prices. The best oppty
for a pullback looks to be post Thanksgiving if BF sales disappoint for techs
with possible targets of SPX 4450 Fri and 4400 EOM. Updates @mrktsignals.
Investment Diary,
Indicator Primer,
Tech/Other Refs,
update 2021.07.xx
Data Mining Indicators - Update, Summer 2021,
update 2020.02.07 Data Mining Indicators,
update 2019.04.27 Stock Buybacks,
update 2018.03.28 Dumb Money/Smart Money Indicators
Article Index 2019 by Topic, completed thru EOY 2020.02.04
Article Index 2018 by Topic
Article Index 2017 by Topic
Article Index 2016 by Topic
Long term forecasts
© 2023 SentimentSignals.blogspot.com
Thanks for the weekly update as usual Arthur, always a treat.
ReplyDeleteAvi Gilburt's 1000 institutional clients should be very pleased (not) by Avi's last minute bearish turn and correction calls since the rally started the end of October. Now Avi of course claims that he saw this rally coming. Pretty shameless this guy. He's probably turning bullish for 4800 when we are at 4700.
Looking at breadth signals though, this rally should continue for a while with very mild pullbacks along the way. It's also very very early in the rally, which usually takes a few months before sizzling out.