Saturday, March 13, 2021

Onward and Upward

Onward and Upward

Not a lot to discuss this week.  As expected, int rates stabilized and a result the NDX rallied, missing the lower retracement target of 13.2k by less than 100 pts.  With the techs and industrials rallying, the SPX was pushed to new ATHs by +10 pts at 3960 before backing off.  The May 2015 analog remains in play with last weeks ATH possibly corresponding to the late Apr ATH.  If so, a two week pullback of about 3% should follow into the EOM and starting after Fri optn exp.

The only sentiment change of significance is a decline in the Hedge Ratio from higher levels that have supported recent rallies.  In the Tech/Other section, I discuss two indicators that seem to point to a Sept-Oct 2018 type top, where we saw a high volume (distribution) top on Sept triple witching optn exp followed by a small pullback and a slightly higher high the next month.  Next week, I will look at the new data mining options indicators that still support the rounded top with a sharp decline unlikely for a number of weeks.


I. Sentiment Indicators

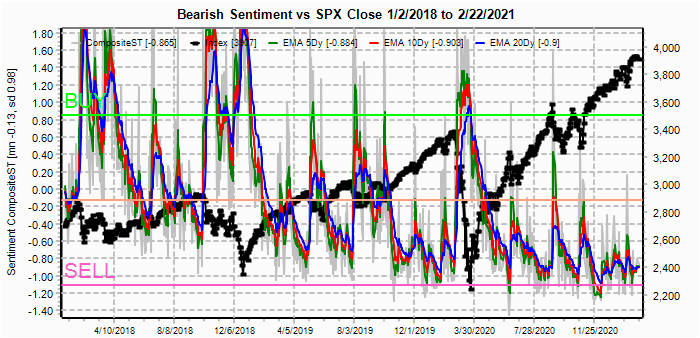
The overall Indicator Scoreboard (INT term, outlook two to four months) bearish sentiment has retreated sharply from the recent spike, but still result in a rally similar to that off the Jan lows.

The INT view of the Short Term Indicator (VXX $ volume and Smart Beta P/C [ETF Puts/Equity Calls], outlook two to four months) bearish sentiment has also declined sharply and continues to put in what appears to be a rounded bottom similar to late 2019.

Bonds (TNX).  Bearish sentiment in bonds finally saw a decent spike with the Mon sharp selloff and te pause in rates between 1.5 to 1.75 % is similar to Jan-Feb 2020 and may be preparing for a push to 2%.

For the INT outlook with LT still negative, the gold miners (HUI) bearish sentiment actually rose last week as bulls seem to be recognizing the threat of higher rates, but the rise in bearish sentiment may extend the rally as seen in Dec 2020.


II. Dumb Money/Smart Money Indicators

The option-based Dumb Money/Smart Money Indicator as short/INT term (outlook 2 to 4 mns/weeks) bearish sentiment continues to reflect the "no fear" attitude of the Robinhood traders and continues to move in a narrow range of low sentiment.

And the sister options Hedge Ratio bearish sentiment continues to be one of the more accurate indicators of ST market moves as near SELLs have preceded pullbacks while neutral readings have been enough to support bounces.


This week I wanted to look at the INT term BKX 3x ETFs (outlook two to four months) bearish sentiment. You have probably noticed the outperformance of the DJIA on days that int rates rise. Much of that is due to the gain in money center banks who profit from borrowing ST and lending LT and with the FED keeping ST rates near zero, higher LT rates increase profits. As a result,  from a low in Mar 2020 near 55 to a recent high over 120, the BKX has now outperformed the NDX and sentiment has reached the SELL level.


III. Options Open Interest

Using Thur closing OI, remember that further out time frames are more likely to change over time, and that closing prices are more likely to be effected. Delta hedging may occur as reinforcement, negative when put support is broken or positive when call resistance is exceeded.  This week I will look out thru Mar 19 and EOM for SPX only.

With Fri close at SPX 3943, options OI for Mon is very small and is showing the potential for whipsaw movement between 3950 and 3900 with a slight bias to below 3925.

Wed has somewhat larger OI where SPX has very small OI between 3850 and 3950 with a small bias to the 3900-25 area.

For Fri PM, SPX has moderate put support up to 3900 and fairly large call resistance at 3950 and above that should contain any rallies.

For Mar 31 EOM, there is a very large strangle at SPX 3500 and 3900 where someone is betting on SPX being locked in that range.  It is very likely that there will be a pullback below 3900 by the EOM.

Using the GDX as a gold miner proxy closing at 33.1 is now up about 8% from its low at 30.5, nearing the 10% expected rally.
 
Currently the TLT is 136.1 with the TNX at 1.62%, where a steepening yield curve has pushed LT rates higher and bond prices lower.

IV. Technical / Other

This week I want to start off with a look at the Equity Puts & Calls, then complete the NDX ETFs with a look at the 3x ETFs.

The Equity Puts & Calls have both dropped sharply with the pullback in the NDX.  It's interesting to compare the three INT tops from Jan and Sept-Oct 2018 and Mar 2020.  Both Jan 2018 and Mar 2020 corrections started with high levels of speculation in both puts & calls and the result was a crash, while Sept-Oct started after a sharp decline in speculation as seen today, and the result was a more complex correction lasting several months.  Personally, I am expecting something more drawn out like late 2018.

As shown in the update for Mon, I cancelled the Buy for the NDX based on the 2x ETF indicator after noticing that they were only 5% of total $ volume and not enough to drive the market.  As shown below, the growth of the 3x ETFs has been huge the last three years.

The 3x ETF bearish sentiment also appears to show a Buy at the recent lows, but the upward slope had me concerned that part of sentiment trend was due to growth in volume, so I decided to use an NDX volume adjustment to replace the SPX adjustment (mostly to adjust for holiday volume and half days).

The result after the NDX volume adjustment looks more reasonable having normalized the ETF $ volume with the recent rise in bearish sentiment matching that of the Sept 2020 pullback of about the same %.  One thing that stands out is that the SQQQ/TQQQ ratio rose on much lower volume in the ETFs and looks more like May and Sept-Oct 2018 than Sept 2020.

Conclusions.   Last weeks ATH blew up the EW ending diagonals that most were looking for, forcing many to flip from bearish to bullish (again).  Many fail to realize that Eliot's work was developed in the 1920s and 30s as a way of estimating sentiment with the only technical requirement being the ability to draw a straight line and count to five.  However, with todays technology and database access you have to expect some short comings in the old ways.
 
Weekly Trade Alert.  There could be a small pullback toward SPX 3900 Mon-Tue as a setup for a rally into options exp Fri, but Fri should at least see a retest of the 3950 area with a 3% pullback to the mid-3800s the next two weeks.  Updates  @mrktsignals.

Investment Diary,  Indicator Primer,
 update 2020.02.07 Data Mining Indicators,
 update 2019.04.27 Stock Buybacks,
 update 2018.03.28 Dumb Money/Smart Money Indicators

Article Index 2019 by Topic, completed thru EOY 2020.02.04
Article Index 2018 by Topic
Article Index 2017 by Topic
Article Index 2016 by Topic

Long term forecasts

© 2021 SentimentSignals.blogspot.com

Saturday, March 6, 2021

Do Interest Rates Matter?

Do Interest Rates Matter?

Last week I was looking for a modest rally in the SPX with the options OI showing storng support up to 3850 with the caveat that int rates (TNX) remained in the 1.4-1.5% range also warning that strong ST bullishness would be LT bearish.  As a result. Mon saw a 100 pt gain to 3920 as rates remained in the 1.45% area, but when rates rose Tue-Wed to 1.62% a sharp selloff occurred down to 3720.  However, Fri when rates dropped to 1.55%, a steady rally all day produced a close at 3842 after reaching a high at 3852.  Again selling was concentrated in the NDX tech sector, dropping from 14k to 12.2k or -13%.  This has produced a Buy for the NDX after a strong Sell in Dec-Jan as shown in the DM/SM section.

Last week also showed two opposing views on the effects of int rates on stock returns with Avi Gilberts "rates don't matter" in SeekingAlpha, while John Mauldins MauldinEconomics produced the following chart showing that virtually all of the SPX returns since 1880 have occurred during times of deflation.  Although not exactly the same, rates tend to rise more in inflationary periods similar to today (see Citi Infl Surprise Index in main section).  The NDX in particular rose in the second half of 1999 and 2020 even as rates rose, but at a certain point when rates began to matter, the effect was swift and dramatic.

As I write this, the Senate has approved the full $1.9T Dem stimulus package with voting strictly on party lines. Mon could be interesting both for stocks and bonds. Fri, OntheMoneyUK came out with a new post repeating what I said last weekend with an ATH target for the SPX by the end of Apr before a larger decline. In Tech/Other I look at the NDX 2x ETFs, but results are disappointing.


I. Sentiment Indicators

The overall Indicator Scoreboard (INT term, outlook two to four months) bearish sentiment has risen modestly, now slightly higher than seen at the Jan selloff which could produce a similar rally to ATHs.

The overall Indicator Scoreboard (INT term, outlook two to four months) bearish sentiment has risen modestly, now slightly higher than seen at the Jan selloff which could produce a similar rally to ATHs.

CITI Surprise Inflation Index for Mar shows a strong pickup in inflation in the US and EU, while China continues to lag.  The US and G10 are now at the highest inflation surprise levels of the past five years.

Bonds (TNX).  Bearish sentiment in bonds rose modestly but continues to lag rates.

For the INT outlook with LT still negative, the gold miners (HUI) bearish sentiment has risen close to the levels seen at the Dec lows and prices may be close to a counter trend rally of several weeks.


II. Dumb Money/Smart Money Indicators

The option-based Dumb Money/Smart Money Indicator as short/INT term (outlook 2 to 4 mns/weeks) bearish sentiment was warning of a potential downturn last week, but has now moved modestly higher that could support a temporary rally.  Sentiment over the past 6-9 months is producing a rounded bottom similar to, but much larger, than what was seen over several months prior to the Mar 2020 selloff.

And the sister options Hedge Ratio bearish sentiment has reversed sharply now close to the level of the Jan lows.


The INT term SPX Long Term (2x/DM) ETFs (outlook two to four weeks) bearish sentiment continues to languish near the levels seen at the Sept-Oct 2018 top.

The INT term NDX Long Term (2x/DM) ETFs (outlook two to four weeks) bearish sentiment has seen a huge move up from the strong Sell level seen in Dec-Jan now reaching a ST Buy, somewhat similar to July 2018.


III. Options Open Interest

Using Thur closing OI, remember that further out time frames are more likely to change over time, and that closing prices are more likely to be effected. Delta hedging may occur as reinforcement, negative when put support is broken or positive when call resistance is exceeded.  This week I will look out thru Mar 12. Also, this week includes a look at the GDX & TLT for Mar 19th exp. 

With Fri close at SPX 3841, options OI for Mon is small with put support at 3925 and call resistance starting at 3875.  At 3900 there is a large straddle with +1000 net puts that may act as an attraction pt with positive news on the new stimulus.

Wed OI is also small where SPX put support moves up to 3850 with first noticeable call resistance at 3925.

For Fri there is much larger put support extending up to 3875 with call resistance starting at 3900.  Overall, should be a mildly positive bias for the week.

For Fri PMs Mar 19, there are several overlapping inflection pts which will likely lead to increased volatility between 3790 and 3880. I still wonder about the large strangle at 3500 and 3900 at EOM.

Using the GDX as a gold miner proxy closing at 31.8, there is fairly strong put support at 30.5 and little net call resistance until 35.5.  There is potential for a 10% rally ST. (Stimulus?)

Currently the TLT is 138.9 with the TNX at 1.55%, prices dropped to the smart money put OI at 140 and 145 and may temporarily relieve downward price pressure.  A drop to 135 or TNX 1.75% is still possible.


IV. Technical / Other

This week I will look at the NDX 2x ETFs.  Similar to the normal chart shown in DM/SM there was a strong Sell in Dec-Jan prior to the current top.   Comparing the results to last weeks SPX 2x ETFs, however, the standard ratio S/L has very low correlation compared to the components, mostly due to the strong Buy due to high bearishness in Oct 2018 which was not that bad very long term.  The problem with he separate ETFs, however, is that they tend to be early as shown by the 5-20 day negative correlations and none of the different combinations produce very high correlations.  So, still a work in progress.


Conclusions.   Overall sentiment for the week increased only modestly, but a large increase in bearishness for the 2x NDX ETF indicator has created a Buy signal that could result in a 50-68% retrace for the decline from 14k, or about 8-10% to 13.2-13.5k.  Reversals in both the Hedge Ratio and DM/SM options indicators are supportive of a rally, but the low bearish levels of the SPX 2x ETFs indicate weakness compared to the NDX or a possible 5-6% rally to 3950-4000.  A Sell on the SPX 2x is likely after the next rally that could produce an SPX decline similar to what was just seen in the NDX.

Weekly Trade Alert.   Recent volatility may temper SPX bullish enthusiasm after the last two weeks 100 pt one-day rallies were followed by 150+ pt declines.  I am expecting more cautious rallies over the next few weeks with continued intra day volatility.  Updates @mrktsignals.

Investment Diary,  Indicator Primer,
 update 2020.02.07 Data Mining Indicators,
 update 2019.04.27 Stock Buybacks,
 update 2018.03.28 Dumb Money/Smart Money Indicators

Article Index 2019 by Topic, completed thru EOY 2020.02.04
Article Index 2018 by Topic
Article Index 2017 by Topic
Article Index 2016 by Topic

Long term forecasts

© 2021 SentimentSignals.blogspot.com

Saturday, February 27, 2021

Right the Wrong Way

Right the Wrong Way

Last week saw more volaility than expected as someone seemed to have decided to dump their bonds probably the Chinese, who had already sold about 30% during Trumps reign, but were hoping to see a more amicable Biden administration and when he continued Trumps trade war, decided to bail, pushing the TNX as high as 1.6%. The result was a 10% drop in the NDX, led by Teslas 30% drop, from 14k to below 13K as higher rates tend to threaten high growth sectors more.

My outlook from Feb 6 was that the the SPX was likely to retest the Jan lows, targeting 3750-3800, but short term I thought we could see strength into mid-week to 3930-50, but by Tue AM the NDX selloff took the SPX down to 3806 before rallying to 3930 Wed. A second retest of the low at 3790 on Thur has now set up a possible successful retest of the Jan lows and is consistent with the mid-2015 pattern shown below. We could still see 3750 as indicated by OntheMoneyUK, but from a contrarian perspective, the more bullish the markets look ST, the more bearish will be the LT result. The key is whether rates stabilize for the next few weeks with the TNX around 1.4-1.5%.  If the mid-2015 analog is followed, a low is near with a slow and choppy path to new ATHs around 3980-90 in mid-late Apr, just in time for "sell in May".  Several recent articles regarding the millennials (ages 25-40) plans to invest additional stimulus money may provide an upward bias.

The data mining alternative to the normal charts turned out to be more dificult than expected so todays Tech/Other only looks at the SPX 2x ETFs. Next week will look at the NDX 2x ETFs.


I. Sentiment Indicators

The overall Indicator Scoreboard (INT term, outlook two to four months) bearish sentiment rose slightly last week, but not enough to support a sustained rally.

The INT view of the Short Term Indicator (VXX $ volume and Smart Beta P/C [ETF Puts/Equity Calls], outlook two to four months) bearish sentiment has rallied more strongly (due to VXX $ Vol below).

The VXX $ Vol rose sharply, exceeding slightly sentiment from the late Jan selloff.  Combined with overall sentiment, this points to a more labored rally with less volatility to crush vol buyers.

Bonds (TNX).  Bearish sentiment in bonds continues to lag behind prices. With the TLT (20 yr) now down 20% from the Mar 2020 highs, a combined 30-40% loss is probable by EOY.

For the INT outlook with LT still negative, the gold miners (HUI) bearish sentiment is close to unchanged and a move in HUI below 250 could easily fall another 20% to 200.


II. Dumb Money/Smart Money Indicators

The option-based Dumb Money/Smart Money Indicator as short/INT term (outlook 2 to 4 mns/weeks) bearish sentiment surprisingly FELL sharply as the dumb money jumped on the BTFD band wagon with both fists and is now approaching the late Dec 2020 levels.

And the sister options Hedge Ratio bearish sentiment also fell sharply after spiking during the Jan pullback.  Less dynamic rallies are likely.

The INT term SPX Long Term (2x/DM) ETFs (outlook two to four weeks) bearish sentiment also surprisingly fell, showing INT investors share much the same complacency as ST options traders.


III. Options Open Interest

Using Thur closing OI, remember that further out time frames are more likely to change over time, and that closing prices are more likely to be effected. Delta hedging may occur as reinforcement, negative when put support is broken or positive when call resistance is exceeded.  This week I will look out thru Mar 5. Fri is jobs report day, and large SPX OI will likely provide guidance for the week

With Fri close at SPX 3811, options OI for Mon show moderate put support at 3800 with minor support up to 3875 where call resistance starts.  Moderate call resistance starts at 3925.  Any early weakness is likely to be reversed.

Wed has smaller OI where SPX moderate put support moves up to 3850 with little net call resistance until 3925.

For Fri very large SPX OI is likely to drive weekly movements with strong put support up to 3850 and should be the minimum target for the week.  Only minor call resistance exists between 3850 and 3950 so a larger rally can not be ruled out.


IV. Technical / Other

The following data mining chart shows the SPX 2x ETF components and the normal ratio.  Sentiment fell to about -1.5 SD before the Jan pullback then rallied to a lower high late Jan.  Surprisingly, the recent pullback saw lower bearish sentiment as longs (SSO) increased faster than shorts (SDS).

In order to examine the SDS & SSO options I set up an algorithm to see the outcomes of various combinations as shown below. As it turns out for an INT indicator, the ratio SDS/SSO (line 4) turns out to have the highest correlation (R).  The next best is line 10, Dif A-B.

The data mining equivalent A-B is shown below and the more erratic movement in 2018 makes the simple ratio more preferable.

Conclusions.   The rounded top I have been anticipating the last two months still seems to be in play with bonds and the PMs also following the expected script.  Most of the bullish sentiment seems to be coming from the millennials who were born at the beginning of the greatest bull market of all time in bonds and have no idea what a secular bear market in bonds can be like (last time was the 70s).  It is very likely that at sometime the Fed will have to chose between saving the bond market or the stock market, imagine the surprise if they chose bonds.

Weekly Trade Alert.   ST weakness to start the week is not impossible, but SPX 3850+ is likely by Fri close with an upward bias to new ATHs thru mid-Apr.  Updates @mrktsignals.

Investment Diary,  Indicator Primer,
 update 2020.02.07 Data Mining Indicators,
 update 2019.04.27 Stock Buybacks,
 update 2018.03.28 Dumb Money/Smart Money Indicators

Article Index 2019 by Topic, completed thru EOY 2020.02.04
Article Index 2018 by Topic
Article Index 2017 by Topic
Article Index 2016 by Topic

Long term forecasts

© 2021 SentimentSignals.blogspot.com

Saturday, February 20, 2021

Deep Freeze in Texas

Deep Freeze in Texas

Last weeks stock market followed "the Big Sideways" outlook to a tea as the SPX tested the high of the range given several weeks ago of 3650-3950 with a Mon top almost exactly3950 before dropping to a lower low than the previous week at 3885 causing the EW analysts to flip/flop once again calling the "5 wave" decline the beginning of a much larger decline.  There are some indications in the SPX options OI of a move up (3930-50) before resumption of the decline, possibly causing the same EW analysts to flip/flop once again.

I am still waiting for the snow and ice to melt before going anywhere, but one good side effects of this pandemic was storing extra food and water in case of shortages so most hardships were avoided.  In the progressive state of Texas, however, who would ever expect a cold wave that would knock power for a week.  So much for going green.

This week will continue looking at some of the new data mining composites in Tech/Other.  In case you wonder where I going with this, I hope to replace the EMA indicators by the summer and these "new" indicators are a first look at possible replacements.  Next week will include ETF indicators for the SPX and NDX.


I. Sentiment Indicators

The overall Indicator Scoreboard (INT term, outlook two to four months) bearish sentiment dropped sharply last week even as prices stalled out.  The majority still seem to be looking for a "melt up" before a "melt down".

The INT view of the Short Term Indicator (VXX $ volume and Smart Beta P/C [ETF Puts/Equity Calls], outlook two to four months) bearish sentiment remains in a tight range near historical lows.

Bonds (TNX).  Bearish sentiment in bonds continues to follow rates higher with little panic even as the TNX reached 1.35% last week.  A move to the 3% level looks likely before reaching the Buy level.  A stall around the 2% level is possible as this would likely be the catalyst for a 10%+ correction in the SPX.

For the INT outlook with LT still negative, the gold miners (HUI) bearish sentiment remains muted even with the breakdown to new lows.  As I have been warning for months, the gold bugs assumption that a pickup in inflation would power gold to 3000 and PMs to the sky was flawed, with a sell off more likely due to the resulting higher interest rates.


II. Dumb Money/Smart Money Indicators

The option-based Dumb Money/Smart Money Indicator as short/INT term (outlook 2 to 4 mns/weeks) bearish sentiment retreated sharply last week, giving up about half the gains from the late Jan decline.

And the sister options Hedge Ratio bearish sentiment declined even more sharply, now close to the levels seen before the late Jan decline.


III. Options Open Interest

Using Thur closing OI, remember that further out time frames are more likely to change over time, and that closing prices are more likely to be effected. Delta hedging may occur as reinforcement, negative when put support is broken or positive when call resistance is exceeded.  This week I will look out thru Feb 26 and EOM Mar. Also, this week includes a look at the GDX & TLT for Mar exp.

With Fri close at SPX 3907, options OI for Mon are very light with only small call resistance at 3950 and first significant put support at 3750.

Wed has similar size OI where SPX shows small support up to 3925 and resistance at 3950.

For Fri EOM, we have large OI with SPX showing strong support at 3850 and strong resistance at 3925 in between is a "no man's land" where straddles are neutral.  Two weeks ago I pointed out that the data mining indicators showed low put-call volume was generally bullish and may carry over to OI and the next week was bullish, so we may see an early week retest of 3950 before weakness later.

For Mar EOM, high call OI at 3875 and 3900 may indicate weakness into late Mar.

Using the GDX as a gold miner proxy closing at 32.7, as I have been warning the lack of put support below 34 and high call resistance above 35 would likely lead to weakness.

Currently the TLT is 143.7 with the TNX at 1.35%, TLT is down 4% from last Fri level of 149 or about the same as a drop in SPX from 3950 to 3800.  I probably should have been looking at the EOQ as the "smart money" puts were hiding in Mar, indicating a drop toward 140.


IV. Technical / Other

This week I want to take a look at a potential replacement for my standard INT and ST composites. For the INT composite I started with the VIX Buy/Sell and Equity P-C indicators, but the volatility in the Equity P-C was not consistent with an INT composite. One of the indicators I referred to in my LT forecasts had been the $NYUPV/$NYDNV using the idea that volume led price with the potential for a 2007-08 setup. As you can see below a sharp drop in relative up volume typically precedes INT tops, so I decided to use a simpler approach and use SPX volume. The result was promising as seen below using equal wts, but still is too volaile.


For the next step I reduced the Equity P-C wt and increased the SPX vol wt which produced a more reasonable output and also increased the "fit" using the correlation (R).


For the ST composite I have only looked at the ETF and SPX calls and puts from the Composite Put-Call indicator using equal wts. Comparing the results of the INT and ST indicators, the conclusion is that the INT composite is showing a setup for something bigger in time and/or price than the corrections seen over the last three years, but the ST composite is showing that the setup is not yet complete.

Conclusions.   Marking time seems to be the most appropriate expression for the current state of the stock market.  Interest rates, however, have decidedly taken a turn higher which is pressuring the PM stocks.  For the stock market, modestly higher rates can be a positive  when an improving outlook for the economy increases the prospects for cyclical stocks (DJIA), but may pressure high growth stocks with low yields (NDX).  At some point (likely TNX between 1.5% to 2%) comparison to the dividend yield, or as some prefer, the earnings yield, reduces the advantage for stocks and an asset allocation back to bonds occurs.  This could continue into the summer with a potential range of SPX 3650-950.  One EW analyst that shares the same outlook is OntheMoneyUK.

Weekly Trade Alert.   SPX options OI indicates early week strength is possible targeting 3930-50 while a decline is likely to 3875-900 by Fri.   Updates @mrktsignals.

Investment Diary,  Indicator Primer,
 update 2020.02.07 Data Mining Indicators,
 update 2019.04.27 Stock Buybacks,
 update 2018.03.28 Dumb Money/Smart Money Indicators

Article Index 2019 by Topic, completed thru EOY 2020.02.04
Article Index 2018 by Topic
Article Index 2017 by Topic
Article Index 2016 by Topic

Long term forecasts

© 2021 SentimentSignals.blogspot.com