Saturday, February 8, 2025

The Shortest Trade War in History

The Shortest Trade War in History

Markets continued their selloff on Mon following the SPX 80 pt drop Fri afternoon after Trump announced 25% tariffs on Canada & Mexico, and after the 1st hr the SPX was down another 100 pts from the Fri high at 6121 to the Mon low at 5924.  However, the BTFDers remained strong and Mexico giving in to Trumps demands followed by Canada on Tue led to a lower high at SPX 6101 Fri before getting knocked down again to 6025 on news of the inflation expt of 4%+ in the UMich sentiment survey.  Many of the sentiment indicators have moved to a more neutral stance and the ST Composite has even moved to a weak Buy, so some consolidation (SPX 5975-6075) seems likely.  The biggest risk next looks to be the Wed CPI report where options OI is indicating a target of 5975-6000 then a bounce into Fri.  The Hedge spread remains between the weak and strong Sells, so volatility is likely to continue.

Other sentiment sources are equally divided with retail investors jumping into the market with near record stock buying going back to the late 1990s and sending volume soaring, while the NAAIIM active manager index has risen to the average of 2024 Q4s level, and the AAII Sentiment survey is showing a 1 year high in bearish sentiment.

Discuss.


I. Sentiment Indicators

The INT/LT Composite indicator (outlook 3 to 6+ months) has three separate components. Starting Aug 26, 2023 SPX options are removed due to extreme 0DTE volume distortions. New weights are ETF put-call indicator (30%), SPX 2X ETF INT ratio (40%), and 3rd a volatility indicator (30%) which combines the options volatility spread of the ST SPX (VIX) to the ST VIX (VVIX) with the UVXY $ volume.

Update Alt, INT view. Bearish sentiment moved up above the weak Sell, but remains below neutral.

Update Alt EMA. Bearish sentiment moved up above the weak Sell, but remains below neutral.

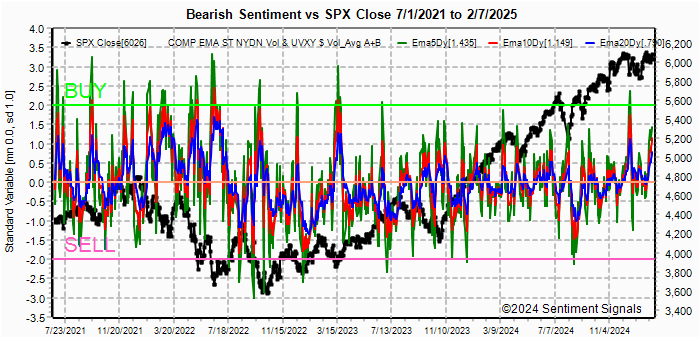
The ST Composite as a ST (1-4 week) indicator includes the NYSE volume ratio indicator (NYDNV/NYUPV & NYDNV/NYDEC) and the UVXY $ Vol/[SPX Trend, SMA only]. Weights are 80%/20%.

Update. Bearish sentiment moved up sharply mid-week above a weak Buy.

Update EMA. Bearish sentiment moved up sharply mid-week above a weak Buy. The ST VIX calls and SPXADP indicator bearish sentiment remains near neutral.
The ST/INT Composite indicator (outlook 1 to 3 months) is based on the Hedge Spread (48%) and includes ST Composite (12%) and three options FOMO indicators using SPX (12%), ETF (12%), and Equity (12%) calls compared to the NY ADV/DEC issues (inverted). FOMO is shown when strong call volume is combined with strong NY ADV/DEC. See Investment Diary addition for full discussion.

Update EMA. Bearish sentiment rose modestly but remains on a weak Sell.

Bonds (TNX).  Bearish sentiment remains at low extremes as rates (TNX) pulled back tp 4.4% before bouncing with Fri inflation expt. For the INT outlook, the gold miners (HUI) bearish sentiment is presented in a new format using the data mining software to add the inverse TNX rate to the ETF ratio.

Update. Bearish sentiment is mostly unchanged with the ETFs near a weak Buy.


II. Dumb Money/Smart Money Indicators

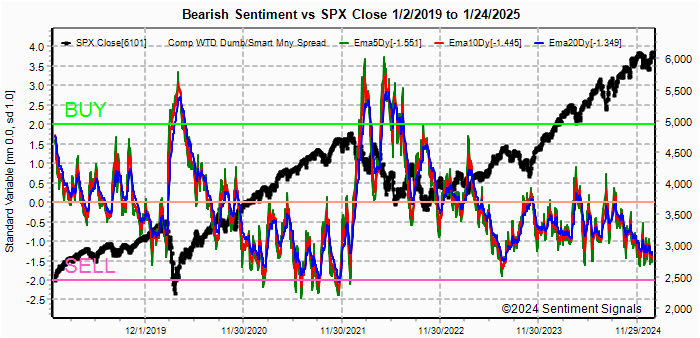
This is a new hybrid option/ETF Dumb Money/Smart Money Indicator as a INT/LT term (outlook 2-6 mns) bearish sentiment indicator. The use of ETFs increases the duration (term).

Update. Bearish sentiment continued to rise to near neutral.

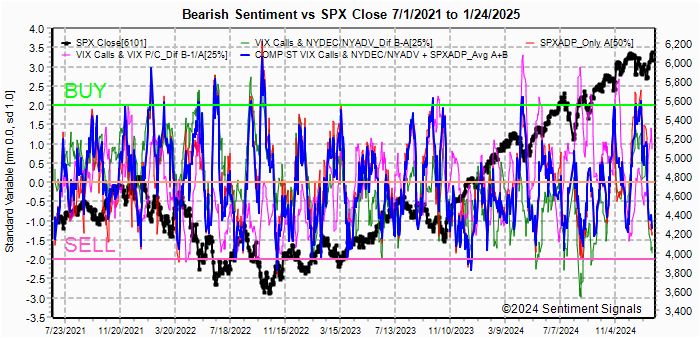
With the sister options Hedge Spread as a ST/INT indicator (outlook 1-3 mns), bearish sentiment remains in between a weak and strong Sell. A new composite SPX options indicator uses both the volume adj (1/B-A) and P/C equivalent spread (A-B) to compensate for the discrepancy between the two.  This replaces the old SPX options indicator for the SPX ETFs + options below and the INT/LT composite. No chart.

For the SPX, I am switching to hybrid 2X ETFs plus SPX options. Taking a look at the INT term composite (outlook 2 to 4 mns), bearish sentiment has recently seen a sharp rise due to the lower options volume adjusted for SPX volume.  This is actually due to an increase in shares traded due to the increase in share purchases by the retail sector.  More below.

Looking at the raw SMA for relative options volume shows the sharp drop in options as the SPX volume is up to about 150% ov avg daily volume. The same pattern was observed after the Oct 2021 pullback about 3 mns before the Jan 2022 top.  However, this time the P/C ratio is much lower and may mean higher risk.
For the NDX combining the hybrid ETF options plus NDX 3X ETF sentiment with the interest rate effect,  (outlook 2 to 4 mns) bearish sentiment shows similar extremes between ETF and options as in late 2020 which resulted in a choppy market until options sentiment rose.  Note QQQ options are optimal, but are N/A and are included in ETF options.

Bearish sentiment rose toward a weak Sell.

For the SPX combining the hybrid ETF options plus SPX 2X ETF (outlook 2 to 4 mns) produces an indicator where, in this case, ETF options are a proxy for the SPY options.

Bearish sentiment for SPX rose above a weak Sell.


III. Options Open Interest

Using Thur closing OI, remember that further out time frames are more likely to change over time, and that closing prices are more likely to be effected. Delta hedging may occur as reinforcement, negative when put support is broken or positive when call resistance is exceeded.  This week I will look out thru Feb 14 & EOM. A text overlay is used for extreme OI to improve readability, P/C is not changed. Also, this week includes a look at the GDX for Dec exp.   A new addition is added for OI $ amounts with breakeven pts (BE) where call & put $ amounts cross. Note multiply OI$ by 100 for shares/contract.

With Fri close at SPX 6025, options OI for Mon is moderate with strong P/C support but even for $ P/C due to large quantity of OTM puts around 5900.  While everyone seems to be expecting a repeat of the last two Mon, a higher close is likely with BE at 6035.
Wed has small SPX OI with CPI coming out.  Here everyone seems to be expecting a drop in CPI. but watch for something like the UMich expectations (higher CPI).  Large straddles at 5950 and 6000 give a negative bias and SPX could reach BE at 5975 or lower.
For Fri moderate SPX OI show relatively strong put support and a week with no new tariffs could send prices back to the 6040-50 area.
For Fri 28th EOM strong SPX OI is somewhat interesting with the steepest support/resistance levels converging on the 6000-6100 range with a slightly lower bias toward 6000-25.


IV. Technical / Other

The following uses barcharts.com as a source and discusses S&P futures (ES) as a third venue of stock sentiment in addition to options and ETFs.  The non-commercial/commercial spread represents a LT bearish sentiment (dumb money/smart money) indicator. As explained in investopedia, commercial investors (red) are institutions and are smart money, while non-commercials (green) are speculators such as hedge funds and are dumb money. Here is the current  barchart graph for the S&P 500 (top) and trader positions (1st bot) with positives as net longs and negatives as net shorts.  Bearish sentiment is represented by the spread and is positive if red > green (Buy) and negative if green > red (Sell).   ES (SPX) sentiment remains at neutral -0.25 SD, NQ (NDX) bearish sentiment is back to a strong Sell at -2.0 SD, YM (DJIA) is neutral at -0.25 SD.

Click dropdown list to select from the following options:

Tech / Other History
2025

2024

2023

2022

Other Indicators

Conclusions.  Time for the superbowl indicator with a win for Philly bullish and KC bearish, what's one more indicator.  Everyone seemed to forget the volatility during Trump one with the numerous on again off again, somewhat outlandish proposals by POTUS.  The idea of tariffs does not seem that absurd when you look at the history of the US as the govt was supported solely by tariffs from 1790-1913 when the Fed Reserve was created and income taxes were added and after WW2 tariffs were almost eliminated, but income taxes were raised as high as 60%.  Both instances seemed likely to help Europe recover from WWs, but that was long ago.  Trump Gaza has been discussed for decades as a means to develop an alt to the Suez canal controlled by the sometimes unfriendly Egypt and Greenland is the last stop between Russia and CA/US.  BTCers seem to be getting nervous with the recent decline below $100k after Trump failed to mention BTC as an option for his sovereign wealth fund and instead proposed Tik Tok.

Weekly Trade Alert.  ST sentiment is slightly positive an may help markets to a positive start for the week, but Wed CPI report is likely to disappoint and send the SPX back below 6k (target 5975)  followed by a turnaround into Fri.  Updates @mrktsignals.

Investment Diary,  Indicator Primer, Tech/Other Refs,
 update 2021.07.xx  Data Mining Indicators - Update, Summer 2021,
 update 2020.02.07 Data Mining Indicators,
 update 2019.04.27 Stock Buybacks,
 update 2018.03.28 Dumb Money/Smart Money Indicators

Article Index 2019 by Topic, completed thru EOY 2020.02.04
Article Index 2018 by Topic
Article Index 2017 by Topic
Article Index 2016 by Topic

Long term forecasts

© 2025 SentimentSignals.blogspot.com

Saturday, February 1, 2025

David vs Goliath in the Tech Arena

What a week!  Sat no one was talking about DeepSeeks R1 AI software, so I was expecting more of a delayed reaction by WS.  However, by Mon that was all anyone was talking about and the mega cap AI stocks led a sharp opening gap from SPX 6101 beyond my downside targets near 6000 to open at 5970 with NVDA down 18%.  Earnings for last quarter were favorable for some of the non-AI large cap stocks, esp IBM which was up 18%, and the BTFD crowd pushed the SPX back up thru Fri AM to fill the Mon gap before news of Trump tariffs send stocks skidding from SPX 6120 to 6030 in a couple of hrs before a close at 6041.  So the weakness call was right but the timing was off.  Trader Joe's latest ES chart shows about what I am looking for, but timing-wise I am hoping for a low mid-Mar to fill the gap near SPX 5850 after EPS season, and a high June-July after tariffs begin to slow the economy.  Factors supporting this are the latest NAAIM report showing a sharp drop in % of bullish active managers to 68% from 86% a couple of weeks ago and the continued outperformance of Germanys DAX supported only by a dovish ECB.

ST sentiment has improved slightly with last weeks pullback as the VIX call & SPXADP moved toward neutral, but the ST composite remains near neutral.  The options FOMO indicator also moved from a strong Sell to above a weak Sell, but the hedge spread indicator remains near a strong Sell.  Nothing to support a rally, but a consolidation between SPX 6025-75 is possible thru mid-week.  SPX options OI suggests weakness EOW into jobs report Fri.

Discuss.


I. Sentiment Indicators

The INT/LT Composite indicator (outlook 3 to 6+ months) has three separate components. Starting Aug 26, 2023 SPX options are removed due to extreme 0DTE volume distortions. New weights are ETF put-call indicator (30%), SPX 2X ETF INT ratio (40%), and 3rd a volatility indicator (30%) which combines the options volatility spread of the ST SPX (VIX) to the ST VIX (VVIX) with the UVXY $ volume.

Update Alt, INT view. Bearish sentiment remains between a weak and strong Sell.

Update Alt EMA. Bearish sentiment improved to a weak Sell. The ST Composite as a ST (1-4 week) indicator includes the NYSE volume ratio indicator (NYDNV/NYUPV & NYDNV/NYDEC) and the UVXY $ Vol/[SPX Trend, SMA only]. Weights are 80%/20%.

Update. Bearish sentiment remains near neutral.

Update EMA. Bearish sentiment improved slightly but remains near neutral.
The ST VIX calls and SPXADP indicator bearish sentiment improved from near a strong Sell to above a weak Sell.
The ST/INT Composite indicator (outlook 1 to 3 months) is based on the Hedge Spread (48%) and includes ST Composite (12%) and three options FOMO indicators using SPX (12%), ETF (12%), and Equity (12%) calls compared to the NY ADV/DEC issues (inverted). FOMO is shown when strong call volume is combined with strong NY ADV/DEC. See Investment Diary addition for full discussion.

Update EMA. Bearish sentiment improved from a strong Sell to in between a weak and strong Sell.

Update options FOMO. Bearish sentiment also reversed sharply from near a strong Sell to in between neutral and a weak Sell.
Bonds (TNX).  Bearish sentiment remains at low extremes as rates tested 4.5% early Fri before reversing upward. For the INT outlook, the gold miners (HUI) bearish sentiment is presented in a new format using the data mining software to add the inverse TNX rate to the ETF ratio.

Update. Bearish sentiment continues to rise as gold made an ATH and the HUI rallied sharply.  Gold appears to be the preferred "safe haven".


II. Dumb Money/Smart Money Indicators

This is a new hybrid option/ETF Dumb Money/Smart Money Indicator as a INT/LT term (outlook 2-6 mns) bearish sentiment indicator. The use of ETFs increases the duration (term).

Update. Bearish sentiment remains low but moved above the weak Sell level.

With the sister options Hedge Spread as a ST/INT indicator (outlook 1-3 mns), bearish sentiment continues to hover near a strong Sell. A new composite SPX options indicator uses both the volume adj (1/B-A) and P/C equivalent spread (A-B) to compensate for the discrepancy between the two.  This replaces the old SPX options indicator for the SPX ETFs + options below and the INT/LT composite. No chart.

For the SPX, I am switching to hybrid 2X ETFs plus SPX options. Taking a look at the INT term composite (outlook 2 to 4 mns), bearish sentiment improved due to bearish positioning in SPX options.

For the NDX combining the hybrid ETF options plus NDX 3X ETF sentiment with the interest rate effect,  (outlook 2 to 4 mns) bearish sentiment shows similar extremes between ETF and options as in late 2020 which resulted in a choppy market until options sentiment rose.  Note QQQ options are optimal, but are N/A and are included in ETF options.

Bearish sentiment remains near a strong Sell.

For the SPX combining the hybrid ETF options plus SPX 2X ETF (outlook 2 to 4 mns) produces an indicator where, in this case, ETF options are a proxy for the SPY options.

Bearish sentiment for SPX continued to fall to a strong Sell as 2x ETF sentiment fell sharply with weak relative buying in SDS.


III. Options Open Interest

Using Thur closing OI, remember that further out time frames are more likely to change over time, and that closing prices are more likely to be effected. Delta hedging may occur as reinforcement, negative when put support is broken or positive when call resistance is exceeded.  This week I will look out thru Feb 7. A text overlay is used for extreme OI to improve readability, P/C is not changed. A new addition is added for OI $ amounts with breakeven pts (BE) where call & put $ amounts cross. Note multiply OI$ by 100 for shares/contract.

With Fri close at SPX 6041, options OI for Mon is moderate with put support starting at 6050.  Likely range SPX 6025-75.
Wed has small SPX OI with small put support at 6025 and larger put support at 6000.  Call resistance starts at 6090.  Could see continued weakness near 6025.
For Fri SPX has moderate OI with balanced P/C, but ITM calls should give negative bias toward 6025 or lower.  Put support is at 6000
For Fri Feb 21 PM still has fairly small OI, but as Fri 7th, ITM calls are likely to give a negative bias toward 6000.


IV. Technical / Other

The following uses barcharts.com as a source and discusses S&P futures (ES) as a third venue of stock sentiment in addition to options and ETFs.  The non-commercial/commercial spread represents a LT bearish sentiment (dumb money/smart money) indicator. As explained in investopedia, commercial investors (red) are institutions and are smart money, while non-commercials (green) are speculators such as hedge funds and are dumb money. Here is the current  barchart graph for the S&P 500 (top) and trader positions (1st bot) with positives as net longs and negatives as net shorts.  Bearish sentiment is represented by the spread and is positive if red > green (Buy) and negative if green > red (Sell).  ES (SPX) sentiment remains at neutral 0.0 SD, NQ (NDX) bearish sentiment is back to a strong Sell at -2.0 SD, YM (DJIA) remains below neutral at -0.5 SD.

Click dropdown list to select from the following options:

Tech / Other History
2025

2024

2023

2022

Other Indicators

Conclusions.  Last week David (China entrepreneurs, DeepSeeks R1) struck a solid blow to Goliath (US deeppockets, NVDA).  The question remains as to whether this will be a serious setback for the US AI tech giants and stocks in general and if so how soon.  The availability of cheaper access to more advanced technology by users is likely to benefit a wider range of the S&P 500 and possibly broaden the rally at some point, but the "shock and awe" effect is not likely over.  Most seem to be looking for a more immediate downturn, aka Trader Joe, while I still think that "back-looking" EPS reports will support stocks for a while.

Weekly Trade Alert.  Possibly some range trading between SPX 6025-75 thru mid-week, but 6000-6025 by Fri.  Updates @mrktsignals.

Investment Diary,  Indicator Primer, Tech/Other Refs,
 update 2021.07.xx  Data Mining Indicators - Update, Summer 2021,
 update 2020.02.07 Data Mining Indicators,
 update 2019.04.27 Stock Buybacks,
 update 2018.03.28 Dumb Money/Smart Money Indicators

Article Index 2019 by Topic, completed thru EOY 2020.02.04
Article Index 2018 by Topic
Article Index 2017 by Topic
Article Index 2016 by Topic

Long term forecasts

© 2025 SentimentSignals.blogspot.com

Saturday, January 25, 2025

Bears Retreat Into Hibernation For Now

Last weeks outlook for a modest pullback before a move back over SPX 6000 fell flat as the Trump party celebrated all week pushing the SPX over 6100 although the Trump and Melania memes fell more than 50%.  So far the SPX is performing much as it did in Nov-Dec 2021 where a one month decline was reversed in just a few days to the low 4700s after a test of the 100D SMA, this time filling the post-election gap at 5780.  If comparisons continue there could be another test of the 100D SMA before a longer breakout over 6100.  On the news front an overlooked item could spell big trouble for the mega cap AI tech sector.  The US has been trying to block Chinas AI development by limiting the export of advanced AI chips, notably NVDAs H-100 which runs on propriety CUDA software.  However, last week a China tech firm announced a new AI product called DeepSeek-R1 (no J/S) which is competitive performance wise with the most advanced US products, but runs on less advanced chips at about 10% of the cost and power usage by using a more advanced modeling language.

Several of the INT and ST indicators, including Hedge Spread, options FOMO and VIX & SPXADP indicators, are at levels suggesting a ST pullback toward the SPX 5800 is likely over the next few weeks.  In the Tech/Other section, an update of LT SKEW and NYSE Adv/Dec volume shows that an INT top is likely in the next several months with the NYSE volume reaching a Sell (100D EMA < 1.5) and SKEW at record highs.


I. Sentiment Indicators

The INT/LT Composite indicator (outlook 3 to 6+ months) has three separate components. Starting Aug 26, 2023 SPX options are removed due to extreme 0DTE volume distortions. New weights are ETF put-call indicator (30%), SPX 2X ETF INT ratio (40%), and 3rd a volatility indicator (30%) which combines the options volatility spread of the ST SPX (VIX) to the ST VIX (VVIX) with the UVXY $ volume.

Update Alt, INT view. Bearish sentiment fell sharply from below neutral to between the weak and strong Sells with a sharp decline in ETF P/Cs (hedging).

Update INT volatility. Bearish sentiment also nose-dived from above a weak Sell to below. Update Alt EMA. Bearish sentiment fell toward a strong Sell. The ST Composite as a ST (1-4 week) indicator includes the NYSE volume ratio indicator (NYDNV/NYUPV & NYDNV/NYDEC) and the UVXY $ Vol/[SPX Trend, SMA only]. Weights are 80%/20%.

Update. Bearish sentiment surprisingly remains near neutral, so a few days around 6100 is possible.

Update EMA. Bearish sentiment is little changed.
The ST VIX calls and SPXADP indicator bearish sentiment continues to fall, but still near a weak Buy.
The ST/INT Composite indicator (outlook 1 to 3 months) is based on the Hedge Spread (48%) and includes ST Composite (12%) and three options FOMO indicators using SPX (12%), ETF (12%), and Equity (12%) calls compared to the NY ADV/DEC issues (inverted). FOMO is shown when strong call volume is combined with strong NY ADV/DEC. See Investment Diary addition for full discussion.

Update EMA. Bearish sentiment fell below a strong Sell with the LT (blu) matching the Nov 2021 level with strong FOMO and weak hedging leading the way.

Update FOMO. Bearish sentiment continues to fall toward a strong Sell. Bonds (TNX).  Bearish sentiment remains at low extremes as TNX briefly dropped toward 4.5%. For the INT outlook, the gold miners (HUI) bearish sentiment is presented in a new format using the data mining software to add the inverse TNX rate to the ETF ratio.

Update. Bearish sentiment continued to rise with the HUI, ETF sentiment moved over neutral but remains below a weak Buy.


II. Dumb Money/Smart Money Indicators

This is a new hybrid option/ETF Dumb Money/Smart Money Indicator as a INT/LT term (outlook 2-6 mns) bearish sentiment indicator. The use of ETFs increases the duration (term).

Update. Bearish sentiment increased slightly.

With the sister options Hedge Spread as a ST/INT indicator (outlook 1-3 mns), bearish sentiment VST (grn) fell sharply from a weak Sell to a strong Sell. A new composite SPX options indicator uses both the volume adj (1/B-A) and P/C equivalent spread (A-B) to compensate for the discrepancy between the two.  This replaces the old SPX options indicator for the SPX ETFs + options below and the INT/LT composite. No chart.

For the SPX, I am switching to hybrid 2X ETFs plus SPX options. Taking a look at the INT term composite (outlook 2 to 4 mns), bearish sentiment fell below neutral.

For the NDX combining the hybrid ETF options plus NDX 3X ETF sentiment with the interest rate effect,  (outlook 2 to 4 mns) bearish sentiment shows similar extremes between ETF and options as in late 2020 which resulted in a choppy market until options sentiment rose.  Note QQQ options are optimal, but are N/A and are included in ETF options.

Bearish sentiment fell sharply from a weak to a strong Sell with the sharp decline in ETF P/Cs (hedging).

For the SPX combining the hybrid ETF options plus SPX 2X ETF (outlook 2 to 4 mns) produces an indicator where, in this case, ETF options are a proxy for the SPY options.

Bearish sentiment for SPX fell from above a weak Sell to near a strong Sell


III. Options Open Interest

Using Thur closing OI, remember that further out time frames are more likely to change over time, and that closing prices are more likely to be effected. Delta hedging may occur as reinforcement, negative when put support is broken or positive when call resistance is exceeded.  This week I will look out thru Jan 31. A text overlay is used for extreme OI to improve readability, P/C is not changed. Also, this week includes a look at the GDX for Dec exp.   A new addition is added for OI $ amounts with breakeven pts (BE) where call & put $ amounts cross. Note multiply OI$ by 100 for shares/contract.

With Fri close at SPX 6101, options OI for Mon is moderate with many OTM P&Cs.  Over 6100 could push higher but below targets 6080.
Wed has smaller OI where SPX could trade between 6050 and 6100.
For Fri EOM, stronger SPX $OI should create downward pressure toward 6000 (straddle) and 6025 (call resistance).  Likely to create downward pressure earlier in week.
For Feb 21 AM strong SPX OI indicates sttrong resistance over 6100 with attraction to large straddle (P&C about 39k) at 6000.

IV. Technical / Other

Oct 2018 topped with SKEW at ATH of 150, 2021 H2 at 160, and now we are at 170.  Lead times have varied, but usually several months.
The SPX price performance since the CPI report mid-Jan was impressive, but the volume has lagged and the NYSE Adv/Dec volume 100D EMA (red) crossed below the Sell level at 1.5.  Something similar occurred in Nov-Dec 2021 prior to the Jan 2022 top, so an INT top may be closer than originally expected.  Watch for a second test of the 100D SMA (SPX 5800-50) and a final burst over 6100 (6250+).


The following uses barcharts.com as a source and discusses S&P futures (ES) as a third venue of stock sentiment in addition to options and ETFs.  The non-commercial/commercial spread represents a LT bearish sentiment (dumb money/smart money) indicator. As explained in investopedia, commercial investors (red) are institutions and are smart money, while non-commercials (green) are speculators such as hedge funds and are dumb money. Here is the current  barchart graph for the S&P 500 (top) and trader positions (1st bot) with positives as net longs and negatives as net shorts.  Bearish sentiment is represented by the spread and is positive if red > green (Buy) and negative if green > red (Sell).   ES (SPX) sentiment remains at neutral 0.0 SD, NQ (NDX) bearish sentiment is between a weak and strong Sell at -1.75 SD, YM (DJIA) remains below neutral at -0.5 SD.

Click dropdown list to select from the following options:

Tech / Other History
2024

2023

2022

Other Indicators

Conclusions.  The stock markets acceleration to the upside last week created considerable capitulation by the bears.  One of the more bullish outlooks is by an EW analyst Dr. Schure who is expecting the SPX to reach 6400-500 in Feb, but I remain more cautious and favor the expanded flat for a couple more months.

Weekly Trade Alert.  Below SPX is an important inflection area and could lead to a drop to SPX 6000-25 by EOM (Fri).  Updates @mrktsignals.

Investment Diary,  Indicator Primer, Tech/Other Refs,
 update 2021.07.xx  Data Mining Indicators - Update, Summer 2021,
 update 2020.02.07 Data Mining Indicators,
 update 2019.04.27 Stock Buybacks,
 update 2018.03.28 Dumb Money/Smart Money Indicators

Article Index 2019 by Topic, completed thru EOY 2020.02.04
Article Index 2018 by Topic
Article Index 2017 by Topic
Article Index 2016 by Topic

Long term forecasts

© 2024 SentimentSignals.blogspot.com