
Weekly outlook gain/loss. Last week I was expecting weakness and recommended shorting at SPX 2090. This was hit Mon AM and I recommended a tight stop at 2095 here due higher than expected VXX $ volume and previous indications of a more bullish outcome with the SPX over 2085. The stop was hit Tues at 2096 on the open, so a weekly loss of 6 pts for a net of +27 the last two weeks. This week may be weak but I expect higher levels before or after the FOMC meeting. No new positions.
Indicator roundup. I forgot this last week which was a decrease to -9 with 1 up, 10 down, and 5 neutral from the prior weeks -5. This week there was very little change with a decrease to -10 with Skew moving to neutral for 0 up, 10 down and 6 neutral. Of note on Tue, there was a very low VIX P/C with over 1.1 M calls - previous similar call volume was seen on Dec 11, two weeks before Dec-Jan slide and three times during the Aug crash.
This week rather than show an indicator update, I wanted to look more closely at the use of put/call ratios and apply the use of a statistical package I found for the testing of the effectiveness of indicators in general.
The put/call data I use comes from the CBOE. Their major categories are CPC (total), CPCI (index), Equity (CPCE), ETF, SPX, and VIX. CPC is essentially the sum of Equity, ETF, SPX, and VIX, while CPCI is the sum of SPX and VIX. You can see this in the table below showing put/call average daily data from two recent months this year using Jan as a down month and Mar as an up month. The sum of the last four categories is about 98% of the CPC calls and 96% of the CPC puts. In both cases the VIX calls represent over 20% of the total while the VIX puts are less than 10% of total. Results for the CPCI with VIX and SPX calls and puts are similar. For my purpose I use a CPC Rev(ised) leaving out the VIX puts and calls, and the SPX for the CPCI.

To test for the significance of the differences in put/call categories with extension to other indicators, I applied a least squares (regression) approach to measure the correlation between different categories and expected returns as shown in the following table. Using data from the last two years that the SPX has been trading between roughly 1800 and 2100, April 1 2014 to April 15, 2016, I applied the regression as Returns = b x Indicator + constant. The measure of fit is the correlation coefficient and is shown in the table below as "coef / b". The correlation varies between 0 and 1 with 1 as a perfect fit. For contrary indicators the "b" should be negative for time 0 (high CPC means low prices), but positive for the future (high CPC means positive future returns). The returns were constructed as the change in SPX between time 0 and 5,10, 20, 40, and 60 days in the future with 20 trading days per month. To concentrate more on the highs and lows I used a 50 day SMA envelope with a +/- 1.5% spread, omitting points inside the envelop. This reduced my data set from 520 days to 320 days. The table below is for the 10 day EMA only.
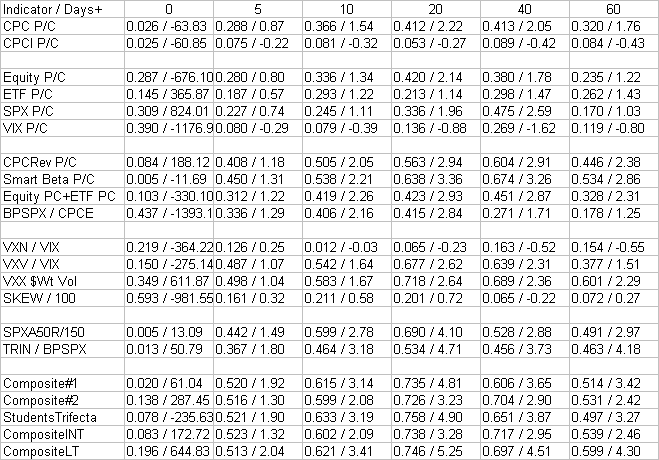
The results for the CPC show a reasonable correlation between .30 and .40, but the CPCI has a very low correlation with a negative b. Looking down, however, you can see that the CPC Rev is much higher rising to .50 and .60 correlation in the 10 to 40 day period and the SPX is also much higher than the CPCI, rising almost to .50 by day 40. The negative effect of including the VIX puts and calls is obvious. I also included the Smart Beta P/C discussed several weeks ago as ETF puts/Equity calls, and it turns out to be even more effective than the CPC Rev or the combined Equity and ETF P/C. The other hybrid the BPSPX/CPCE is more effective than the CPC or CPCE shorter term, but less so for 40 and 60 days.
Of the four volatility measures, the VIX term structure for the SPX (VXV/VIX) and VXX $ volume are the most effective with the VXV/VIX less so for longer terms (60 days). The NDX VIX term structure (VXN/VIX) appears useless and even has a negative b, while the SKEW appears to be somewhat effective, but only up to 20 days. The two additional components used in the Students Trifecta with the VIX term structure, the overbought/ oversold indicator (SPXA50R/SPXA150R) and the TRIN/BPSPX are both slightly weaker than the VIX term structure short term, but stronger long term.
The various composites, including two new ones, show very similar results with correlations in the .50s at 5 days, .60s at 10 days, .70s for 20 days, then declining to the .50s by 60 days. To summarize with CompositeINT (intermediate term) and CompositeLT (long term):
- Composite#1, SPX P/C + VIX $ Vol + SKEW
- Composite#2, CPC Rev + VIX $ Vol + VIX term structure
- Students Trifecta, VIX term structure + SPXA50R/SPXA150R + TRIN/BPSPX
- CompositeINT, Smart Beta P/C + VIX $ Vol + VIX term structure
- CompositeLT, VIX $ Vol + VIX term structure + SPXA50R/SPXA150R
As of next week I will be dropping the VXN/VIX indicator and replacing it with the Smart Beta P/C.
No comments:
Post a Comment