
What I see is a range bound market where the majority become bullish at the top, providing ammunition for the next decline and then becoming bearish at the bottom setting up a repeat of the cycle. Admittedly, intervention by the world's central bankers may distort asset valuations, but the effects should not be unanticipated. Japan, which was the initiator of QE and many unorthodox policies since the late 1990's, has seen the Nikkei trade in a range from about 16,000 to 20,000 for almost 20 years. Thus the somewhat confusing title, i.e., markets may remain on life support to maintain vital functions, but this does not means the patient will get out of bed and start dancing the jig.
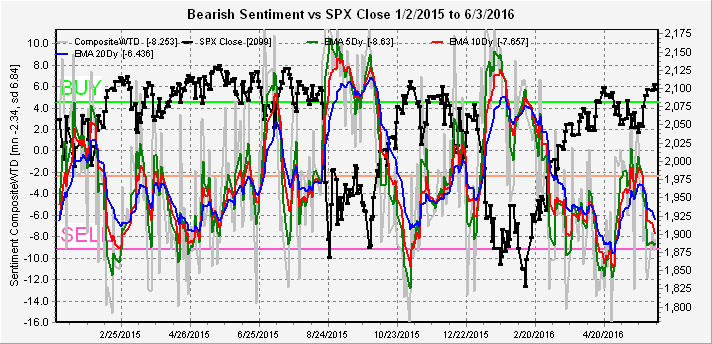
Indicators are little changed this week, thus the earlier rant. The overall Indicator Scoreboard still shows low bearish sentiment in a pattern resembling the April-May 2015 period.
Since I have not done so previously, I decided to do a back test to the 2013-14 period using the Indicator Scoreboard. Here we see that during periods of strongly rising prices, very low bearish sentiment such as in Dec 2013 and June 2014 may only result in consolidations or weak declines compared to the volatile periods in 2015 and 2016.

Conclusion. I am expecting a widening of the trading range of the last week and a half of SPX 2085 to 2105 with a low of 2070/80 and a high of 2115/25. Most are expecting a continuation of the decline from Friday, so since I rarely follow the crowd, I am looking for a rally early in the week then a decline. I was right about the weak employment numbers based in the initial jobless claims from two weeks ago, but the numbers have already reversed sharply so this may be a one time event. Click 1 yr here to see.
Weekly trade alert. The weak job numbers are likely to be read as "no rate hike", so I'm expecting a rally early in the week then a stronger selloff as most of last week looked like distribution. So for the SPX short at 2120, stop at 2135, cover at 2080 or better. Trade updates @mrktsignals.
No comments:
Post a Comment