To review, here are the composites in reverse chronological order to usage:
- CompositeST, combines the VXX $ Volume and Smart Beta P/C as the highest correlated with statistical test on short term returns
- CompositeWTD, combines 16 indicators weighted by correlation with returns
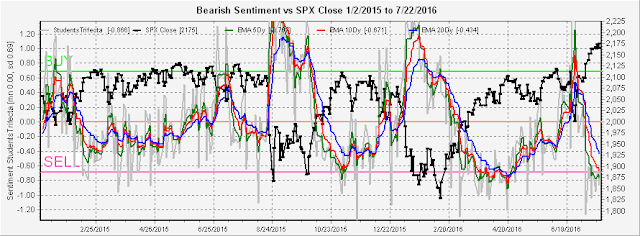
- Students Trifecta, combines the VIX term structure, TRIN, and overbought/oversold indicator, created by the Humble Student
- Composite#2, combines the CPC Rev, VXX $ Vol, and VIX term structure
- Composite#1, combines the SPX P/C, VXX $ Vol, and SKEW.
First to show the VIX P/C, which does not support an immediate bearish outcome, but a more likely choppy period ahead. Until the VIX P/C drops below 0.50, the SPX could continue in a similar pattern to early 2015, then in January the markets saw a sharp but short drop that quickly reversed for a gain two times the loss before leveling off.
The CompositeST paints a completely different story with a near vertical drop, resembling the July 2015 period more than the February 2015 period.
The CompositeWTD matches the extremes seen at other market tops since January of 2015, but does differentiate between the 2015 tops of February and July.
The Students Trifecta, which I haven't mentioned for several months, did reverse from a SELL in April to a BUY in June and is currently in the same position as the 2015 tops in February and November.
The Composite#2, influenced heavily by P/C ratios, shows an extreme most similar to the April-May period of 2015.
The Composite#1, influenced heavily by P/C ratios, shows an extreme that was only shown at the November 2015 top.
Conclusion. Virtually all of the composites point to strong indications of a near term top, but several different topping patterns are possible. Personally, I still prefer the 2007 analog mentioned last week, but until I see lower VIX P/C ratios a choppy price behavior is more likely.
Weekly trade alert. As posted at @mrktsignals, I did take a stab at shorting the SPX at 2168, but was stopped out the Friday on a reversal for a 2 pt loss. Next week, I am looking for the 2185 area to re-short. Given how quickly the 1 year unemployment claims have fallen since June, the FOMC may come out hawkish again and that could repeat last week's Thursday selloff, Friday recover pattern.


This comment has been removed by a blog administrator.
ReplyDeleteAll of my charts are originals. So here is the only place.
Delete