Every day I hear more and more analysts predicting a continued rally in the SPX thru 2018 with a price target EOY of 3,000. As a contrarian, this reminds me of Q4 2015 with the SPX at 2,100 when the consensus was an SPX target of 2,400 the first half of 2016, but after the Jan-Feb decline to the 1800's targets dropped to 1300 or lower. More likely scenarios seem to be the melt up-melt down scenario proposed by Ed Yardeni in June, now seeing SPX 3,100 by June 2018, or my preferred scenario of the beginning of a 1970-72 type bear market. The key, as I see it, is the reaction of the bond market to the Fed's reduction of its balance sheet, a once in a lifetime event. More in my long term forecast, due over the next two weeks.
I. Sentiment Indicators
This week, I will only look back two years to look more closely at the Jul-Aug 2016 period which seems most like the current period. The overall Indicator Scoreboard saw a sharp drop in bearish sentiment before a slight uptick on Friday. Sentiment is now at similar levels to the Jul-Aug 2016 and Feb-Mar 2017 tops.
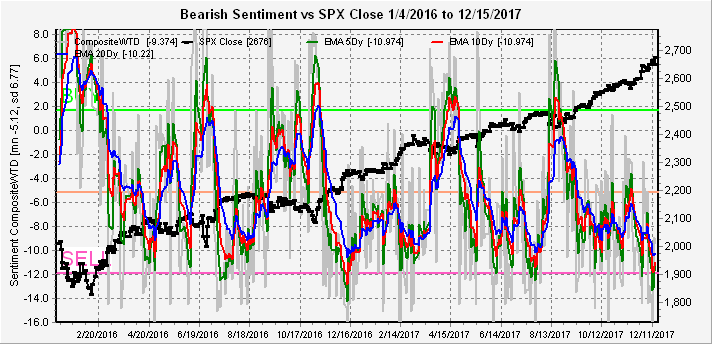
The Short Term Indicator (VXX $ volume and Smart Beta P/C) also saw a sharp drop in bearishnes, but a continued decline in the longer term EMAs is likely before a top.
The NDX sentiment also saw a sharp drop, but remains moderately bullish, and provides the strongest argument for strength in prices possibly thru early Jan.
Bond sentiment (TNX) continued its sharp rise in bearish volume in TBT vs TLT, which is surprising given the small change in TNX outside the drop on lower than expected CPI. To me this looks like smart money positioning ahead of a trend change, rather than retail investors panicking after the fact.
For the gold miners (HUI), bearish sentiment fell sharply with the one day jump in prices with the weak CPI data. As i have pointed out before inflation is not a friend to gold stocks at this time as it simply means higher interest rates. Some gold bugs are now calling for a new bull market, but bearish sentiment is well below the levels of EOY 2016 and does not support a sustained advance.
II. Options Open Interest
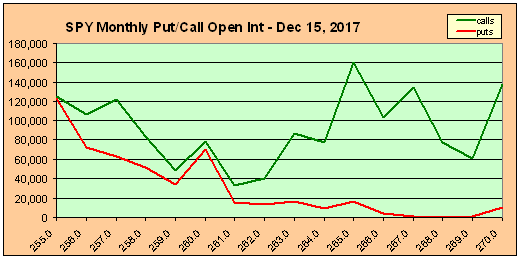
It was no surprise that the high call levels for Dec opt exp provided little resistance to higher prices on the SPY, but the high calls for Dec 29 at 266-7 did act as smart money with a Fri high of 267. This week I want to take a broader look at the SPY, VIX and GDX open int thru Jan 2018.
For the SPY next Wed, at the current 267, there is little put support and call resistance could push down to 265 or delta hedging could push up to 269+.
The VIX shows a very high open int level on Wed at about 50% the Jan monthly and 5-10x the other weeklies with a "most likely" of 12.5, so it's possible someone is expecting a blowoff to SPY 269+ (SPX ~2700) followed by a sharp drop on the tax plan approval.
For Fri, the SPY shows a "most likely" range of 264-5.
For Fri Dec 29, the SPY open int has dropped 50% since last week, so the smart money has covered half their position, indicating that much of the expected gains have been seen. The "most likely" drops to 263.
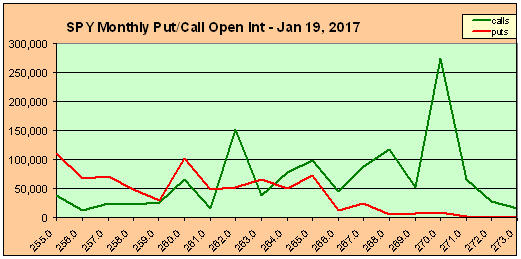
Looking out to the Jan 2018 monthlies, the SPY has very call resistance at 270 and moderate resistance down to 262 with only weak put support at 260 with a "most likely" range of 261-3.
Looking at the Jan VIX open int, the "most likely" range is 13-14 showing a moderate pickup in volatility is expected.
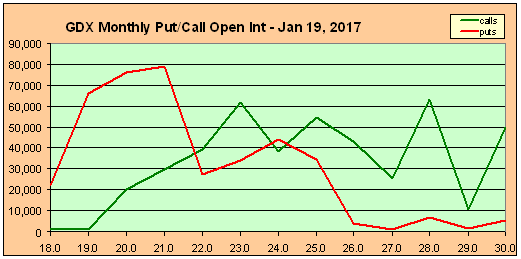
The GDX looks like it could get a safe haven bid if the stock market falters with a "most likely" range of 22-24.
Conclusions. Last week did not provide any low risk entries with the SPX up 1% for the week, mostly on Fri opt exp. With the tax proposal finalized last Fri, Senate & House approval may be next week. I am not sure how reliable the option open int may be based on the last few weeks, but Wed may provide an important turn date around the SPX 2700 level based on the unusual VIX data. Overall, I expect some type of short term pullback as a "sell the news" with a final rally into early Jan before a larger decline.
Weekly Trade Alert. Next week could see a pickup in volatility if the tax plan is approved . Short at SPX 2700 or better with a target of 2650-60. Updates @mrktsignals.
Investment Diary, update 2017.10.28, Indicator Primer
Article Index 2017 by Topic
Article Index 2016 by Topic
© 2017 SentimentSignals.blogspot.com
Saturday, December 16, 2017
Saturday, December 9, 2017
Naughty or Nice
Two weeks ago my view was that we would see a short term top with the Senate passage of a tax plan in the SPX over 2600 (est 2610-15, act 2665) followed by a pullback into mid-Dec probably due to the Fed raising rates at the next FOMC (Dec 12-13). Last week I gave a downside target of SPX 2605-10, but it now looks like a higher low is probable. I do not recommend shorting, however, due to positive sentiment.
I. Sentiment Indicators
The overall Indicator Scoreboard improved slightly by mid-week then fell back as the market rallied thru Fri, but still consistent with the July-Aug 2016 consolidation phase.
The Short Term Indicator (VXX $ volume and Smart Beta P/C) has just fallen to neutral, so there is no clear market direction indicated. Combined with the overall Indicator Scoreboard, it raises a question concerning additional downside or indicates that any downside will be quickly reversed.
The NDX sentiment remains strongly bullish as all EMAs hover around the 1.20 BUY level. I wonder how much of the tech advance is fueled by the BitCoin mania.
Bond sentiment (TNX) saw a fairly sharp rise as rates rose back to 2.4% level and seem to be forming a triangle of sorts, but it is hard to tell if this will lead to a breakout to higher rates. Stocks are likely to be effected by rates rising to the 2.7-2.8% level.
For the gold miners (HUI), bearish sentiment has started to rise as price fell to the 180 level, but remain far short of the late 2016 level before for the year-end rally began. A continued fall to the 160 level or lower is probably needed before a sharp rally is possible.
II. Options Open Interest
Options open int has proven pretty ineffective the last couple of weeks as high call levels have provided little resistance to higher prices in the SPY (current 265.5). This week I will look out to Dec 29 which shows a surprising level of calls.
For Wed, there is strong call resistance for SPY at 266-7 and little put support until 260, so 261 is a reasonable target if there is any surprise at the FOMC. However, given the departure of Queen Yellen next month, coupled with benign inflation and jobs data, no surprises are likely other than the expected rate hike.
For the monthly/qtrly opt exp, the chart indicates a "most likely" range of 259-262 with strong resistance at 265-7. Again, past resistance has been futile, so it's really hard to argue for a strong pullback.
The year-end Dec 29 open int is very interesting simply due to the HUGE open int at SPY 266-7 (ex-div = SPX 2670-80). This is over 3x the Dec qtrly and probably represents smart money (Soros or GS) betting on a House/Senate tax compromise.
Conclusions. Next week could be very interesting if we see a continuation of the current decline as an abc which could peak in the SPX 2655-60 range with a second 40 pt pullback to SPX 2615-20. The normal indicators are not very bearish ST, however, so any pullback could be reversed quickly. Options OI indicates the strong potential for a rally into year-end if the Dec 29 OI are smart money.
Weekly Trade Alert. I have not recommended shorting lately since the rally is likely to continue for now, so the low risk trade is to go long on a potential pullback sometime next week, hopefully in the SPX 2615-20 range with a target near SPX 2700 by year-end. Updates @mrktsignals.
Investment Diary, update 2017.10.28, Indicator Primer
Article Index 2017 by Topic
Article Index 2016 by Topic
© 2017 SentimentSignals.blogspot.com
I. Sentiment Indicators
The overall Indicator Scoreboard improved slightly by mid-week then fell back as the market rallied thru Fri, but still consistent with the July-Aug 2016 consolidation phase.
The Short Term Indicator (VXX $ volume and Smart Beta P/C) has just fallen to neutral, so there is no clear market direction indicated. Combined with the overall Indicator Scoreboard, it raises a question concerning additional downside or indicates that any downside will be quickly reversed.
The NDX sentiment remains strongly bullish as all EMAs hover around the 1.20 BUY level. I wonder how much of the tech advance is fueled by the BitCoin mania.
Bond sentiment (TNX) saw a fairly sharp rise as rates rose back to 2.4% level and seem to be forming a triangle of sorts, but it is hard to tell if this will lead to a breakout to higher rates. Stocks are likely to be effected by rates rising to the 2.7-2.8% level.
For the gold miners (HUI), bearish sentiment has started to rise as price fell to the 180 level, but remain far short of the late 2016 level before for the year-end rally began. A continued fall to the 160 level or lower is probably needed before a sharp rally is possible.
II. Options Open Interest
Options open int has proven pretty ineffective the last couple of weeks as high call levels have provided little resistance to higher prices in the SPY (current 265.5). This week I will look out to Dec 29 which shows a surprising level of calls.
For Wed, there is strong call resistance for SPY at 266-7 and little put support until 260, so 261 is a reasonable target if there is any surprise at the FOMC. However, given the departure of Queen Yellen next month, coupled with benign inflation and jobs data, no surprises are likely other than the expected rate hike.
For the monthly/qtrly opt exp, the chart indicates a "most likely" range of 259-262 with strong resistance at 265-7. Again, past resistance has been futile, so it's really hard to argue for a strong pullback.
The year-end Dec 29 open int is very interesting simply due to the HUGE open int at SPY 266-7 (ex-div = SPX 2670-80). This is over 3x the Dec qtrly and probably represents smart money (Soros or GS) betting on a House/Senate tax compromise.
Conclusions. Next week could be very interesting if we see a continuation of the current decline as an abc which could peak in the SPX 2655-60 range with a second 40 pt pullback to SPX 2615-20. The normal indicators are not very bearish ST, however, so any pullback could be reversed quickly. Options OI indicates the strong potential for a rally into year-end if the Dec 29 OI are smart money.
Weekly Trade Alert. I have not recommended shorting lately since the rally is likely to continue for now, so the low risk trade is to go long on a potential pullback sometime next week, hopefully in the SPX 2615-20 range with a target near SPX 2700 by year-end. Updates @mrktsignals.
Investment Diary, update 2017.10.28, Indicator Primer
Article Index 2017 by Topic
Article Index 2016 by Topic
© 2017 SentimentSignals.blogspot.com
Saturday, December 2, 2017
Irrational Skepticism
Everyone is talking about irrational exuberance as the stock market seems to climb to unimaginable heights, but watching the ebb and flow of trading during the day, the bears are just as irrational as the bulls. Particularly on days when we see strong advances, money flows into options and volatility products as the bears look for sharp reversals or crashes. Fridays mini flash crash in the SPX of 45 pts for about 30 min resulted in almost 2.4 M VIX calls traded, the highest in my DB from 2010; the next highest (less than 2.0 M) were Aug 10 and Sept 25 of 2017, both during important bottoming periods. The VXX $ volume at $3.5 B was only 15th from the high, but still significant at 3x daily avg.
I. Sentiment Indicators
This week I am going to looking at more of a variety in the indicators as we see both BUY and SELL indicators conflicting. The overall Indicator Scoreboard saw a sharp drop in bearishness, mostly due to a huge spike in call buying, to levels that have seen important tops or near tops in the past several years.
Looking at the CPC Revised (combined P/C less VIX options), there have only been two similar cases this low since 2015, Jul 2016 and Jan 2017, both resulted in consolidation or pullbacks. Given the Jan proximity to the BUY spike the previous Nov, Jul 2016 seems most relevant. This implies limited upside for a few weeks followed by a multi-month correction, most likely a top by early Jan 2018, followed by a 5-7% decline into Mar.
The Short Term Indicator (VXX $ volume and Smart Beta P/C) is telling a somewhat different story, with a large spike producing the equivalent of a ST EMA BUY (not shown).
Bond sentiment (TNX) saw bearish levels fall back to neutral as rates retreated slightly.
For the gold miners (HUI), sentiment and prices are mostly unchanged.
II. Options Open Interest
SPY open interest did not provide much of a clue last week as call resistance at 261 was easily overcome and ended up being support in Friday's mini flash crash. Next Fri shows strong resistance again at 265 (current 264.5) with "most likely" at 261, but given the ST Indicator ST BUY this is likely to be easily overcome.
For the Dec opt exp, ordinarily this would be very bearish, indicating a drop to at least SPY 260 and possibly 255, but as I showed similar sentiment out to Mar 2018 last week, what may end up happening is an "overrun" due to the tax bill plus seasonality and then a pullback into Mar 2018.
III. Technical Indicators
A couple indicators worth keeping an eye on are the $SKEW and the High Risk Volume Indicator. The SKEW early last week dropped to as low as 124 and would be expected to rise toward 140 before a Mar-Apr 2017 type pullback. The HR Vol Indicator measures supporting volume and had been rising toward the SELL level but last week's rallies showed strong supporting volume, pulling it back down. Fridays very strong VIX call buying again gave a weak BUY, rising by 46% of average.
Conclusions. Two weeks ago, I indicated that positive ST sentiment plus progress in the Senate on the tax bill would likely carry the market over SPX 2600 thru Dec 1. So I got the dates right (off by 1 day) but missed the upside target by almost 40 pts, but bubbles surprise to the upside. We need to have a consolidation period to wear down the bears and the extreme put/call ratios indicate this should occur soon, but the spike in the ST Indicator points to more upside. The net result should be a positive bias into year-end, but a more subdued advance with a year end target of 2700+.
Weekly Trade Alert. The spike in VXX volume has usually resulted several more days of volatility before the rally resumes, so I am looking for a "sell the news" retest of the recent lows. Tentative Long SPX 2605-10 but with a lot of hesitation. Updates @mrktsignals.
Investment Diary, update 2017.10.28, Indicator Primer
Article Index 2017 by Topic
Article Index 2016 by Topic
© 2017 SentimentSignals.blogspot.com
I. Sentiment Indicators
This week I am going to looking at more of a variety in the indicators as we see both BUY and SELL indicators conflicting. The overall Indicator Scoreboard saw a sharp drop in bearishness, mostly due to a huge spike in call buying, to levels that have seen important tops or near tops in the past several years.
Looking at the CPC Revised (combined P/C less VIX options), there have only been two similar cases this low since 2015, Jul 2016 and Jan 2017, both resulted in consolidation or pullbacks. Given the Jan proximity to the BUY spike the previous Nov, Jul 2016 seems most relevant. This implies limited upside for a few weeks followed by a multi-month correction, most likely a top by early Jan 2018, followed by a 5-7% decline into Mar.
The Short Term Indicator (VXX $ volume and Smart Beta P/C) is telling a somewhat different story, with a large spike producing the equivalent of a ST EMA BUY (not shown).
Bond sentiment (TNX) saw bearish levels fall back to neutral as rates retreated slightly.
For the gold miners (HUI), sentiment and prices are mostly unchanged.
II. Options Open Interest
SPY open interest did not provide much of a clue last week as call resistance at 261 was easily overcome and ended up being support in Friday's mini flash crash. Next Fri shows strong resistance again at 265 (current 264.5) with "most likely" at 261, but given the ST Indicator ST BUY this is likely to be easily overcome.
For the Dec opt exp, ordinarily this would be very bearish, indicating a drop to at least SPY 260 and possibly 255, but as I showed similar sentiment out to Mar 2018 last week, what may end up happening is an "overrun" due to the tax bill plus seasonality and then a pullback into Mar 2018.
III. Technical Indicators
A couple indicators worth keeping an eye on are the $SKEW and the High Risk Volume Indicator. The SKEW early last week dropped to as low as 124 and would be expected to rise toward 140 before a Mar-Apr 2017 type pullback. The HR Vol Indicator measures supporting volume and had been rising toward the SELL level but last week's rallies showed strong supporting volume, pulling it back down. Fridays very strong VIX call buying again gave a weak BUY, rising by 46% of average.
Conclusions. Two weeks ago, I indicated that positive ST sentiment plus progress in the Senate on the tax bill would likely carry the market over SPX 2600 thru Dec 1. So I got the dates right (off by 1 day) but missed the upside target by almost 40 pts, but bubbles surprise to the upside. We need to have a consolidation period to wear down the bears and the extreme put/call ratios indicate this should occur soon, but the spike in the ST Indicator points to more upside. The net result should be a positive bias into year-end, but a more subdued advance with a year end target of 2700+.
Weekly Trade Alert. The spike in VXX volume has usually resulted several more days of volatility before the rally resumes, so I am looking for a "sell the news" retest of the recent lows. Tentative Long SPX 2605-10 but with a lot of hesitation. Updates @mrktsignals.
Investment Diary, update 2017.10.28, Indicator Primer
Article Index 2017 by Topic
Article Index 2016 by Topic
© 2017 SentimentSignals.blogspot.com
Saturday, November 25, 2017
Gobble Gobble
The last two weeks I had been expecting a rally in SPX up to 2600+ based on a short term burst of bearish sentiment, but the rally is now running out of steam. Next week could see a top in the SPX 2010-15 area before a Dec pullback to the mid 2500s. Looking forward using options open interest a topping process similar to the first half of 2015 may be forming as SPX 2550-2600 seems to be the most likely range through Mar 2018.
I. Sentiment Indicators
The overall Indicator Scoreboard seems to be stair-stepping its way higher similar to the pattern seen the first half of 2015, but appears to need to reach lower levels yet before a pullback.
The Short Term Indicator (VXX $ volume and Smart Beta P/C) is still a ways from reaching a SELL and seems to be following a stair step decline lower, with lower levels needed before a pullback.
The Smart Beta P/C (ETF puts/Equity calls) is hovering at extremely low levels similar to the Apr and Nov 2015 topping patterns, leading me to believe that additional upside will be very limited.
The VXX $ volume has barely receded to the mean and should go lower before any pullback. Undoubtedly the continued insistence that a major crash is just around the corner by many Wall Street "gurus" is the probable cause of volatility plays, but it is unlikely that Mr. Market will play friendly with such sentiment.
The other indicator which has supported higher prices is the NDX ETF ratio SQQQ/TQQQ and we see that it now approaching prior lower levels that were seen before pullbacks.
Bond sentiment (TNX) remains above the mean, but the rounded bottom still looks a lot like that of mid-2016 before rates raced higher.
For the gold miners (HUI), the change from last week is barely noticeable as sentiment and prices ticked slightly higher.
II. Options Open Interest
Last week started strong as expected, but the rally held thru Fri with the SPY slightly over the "most likely" at 259. At the peak call resistance of 260, the SPY could go either way early in the week.
But later in the week, larger put position should push prices higher with moderate call resistance at SPY 260 and 261. The "most likely" close is 259.
The week after, the "most likely" drops to SPY 258, but little call resistance above could indicate higher interim prices.
Next opt exp, call resistance is strong over SPY 255 and should push prices lower with the "most likely" at 255. The drop off in puts below 255 could result in lower prices.
Farther out in Jan 2018, prices look likely to be range bound between SPY 255 and 260 with a slight downward bias to 255 and a "most likely" at 258.
Even as far out as Mar 2018, the most likely trading range is SPY 255 to 260.
Conclusions. The combination of relatively low overall bearish sentiment, combined with the extremely low Smart Beta PC supports very limited upside in SPX prices as indicated by the options OI, while the neutral VXX $ volume indicates low volatility supporting the trading range of SPY 255 to 260 as indicated by the options OI.
Weekly Trade Alert. Guidelines from here are very tricky, but I am looking for a little more upside thru Fri. Ideal target to short is SPX 2610-15 with a mid Dec target of 2550 or lower. Updates @mrktsignals.
Investment Diary, update 2017.10.28, Indicator Primer
Article Index 2017 by Topic
Article Index 2016 by Topic
© 2017 SentimentSignals.blogspot.com
I. Sentiment Indicators
The overall Indicator Scoreboard seems to be stair-stepping its way higher similar to the pattern seen the first half of 2015, but appears to need to reach lower levels yet before a pullback.
The Short Term Indicator (VXX $ volume and Smart Beta P/C) is still a ways from reaching a SELL and seems to be following a stair step decline lower, with lower levels needed before a pullback.
The Smart Beta P/C (ETF puts/Equity calls) is hovering at extremely low levels similar to the Apr and Nov 2015 topping patterns, leading me to believe that additional upside will be very limited.
The VXX $ volume has barely receded to the mean and should go lower before any pullback. Undoubtedly the continued insistence that a major crash is just around the corner by many Wall Street "gurus" is the probable cause of volatility plays, but it is unlikely that Mr. Market will play friendly with such sentiment.
The other indicator which has supported higher prices is the NDX ETF ratio SQQQ/TQQQ and we see that it now approaching prior lower levels that were seen before pullbacks.
Bond sentiment (TNX) remains above the mean, but the rounded bottom still looks a lot like that of mid-2016 before rates raced higher.
For the gold miners (HUI), the change from last week is barely noticeable as sentiment and prices ticked slightly higher.
II. Options Open Interest
Last week started strong as expected, but the rally held thru Fri with the SPY slightly over the "most likely" at 259. At the peak call resistance of 260, the SPY could go either way early in the week.
But later in the week, larger put position should push prices higher with moderate call resistance at SPY 260 and 261. The "most likely" close is 259.
The week after, the "most likely" drops to SPY 258, but little call resistance above could indicate higher interim prices.
Next opt exp, call resistance is strong over SPY 255 and should push prices lower with the "most likely" at 255. The drop off in puts below 255 could result in lower prices.
Farther out in Jan 2018, prices look likely to be range bound between SPY 255 and 260 with a slight downward bias to 255 and a "most likely" at 258.
Even as far out as Mar 2018, the most likely trading range is SPY 255 to 260.
Conclusions. The combination of relatively low overall bearish sentiment, combined with the extremely low Smart Beta PC supports very limited upside in SPX prices as indicated by the options OI, while the neutral VXX $ volume indicates low volatility supporting the trading range of SPY 255 to 260 as indicated by the options OI.
Weekly Trade Alert. Guidelines from here are very tricky, but I am looking for a little more upside thru Fri. Ideal target to short is SPX 2610-15 with a mid Dec target of 2550 or lower. Updates @mrktsignals.
Investment Diary, update 2017.10.28, Indicator Primer
Article Index 2017 by Topic
Article Index 2016 by Topic
© 2017 SentimentSignals.blogspot.com
Saturday, November 18, 2017
Going Nowhere Fast
Last week was even more choppy than expected with several gap down openings early in the week, but Thurs bounced back strongly to within a few pts of the SPX ATH. The early week weakness started in Asia during Trump's three day trip and seemed to be precipitated by Trump's me-first trade policies with weakness in Asia spilling into Europe then the US. Overall expectations remain of higher highs before a mid-Dec pullback.
I. Sentiment Indicators
I am probably as frustrated as anyone by the lack of clear market direction, but much of the markets ambivalence is due to uncertainty about the tax proposal and its possible that a short term pop happens with the Senate passing their plan, but that a compromise plan with the House may not be agreed upon for several months.
The overall Indicator Scoreboard continued its push back to neutral so there is little to indicate a preferred market direction.
The Short Term Indicator (VXX $ volume and Smart Beta P/C) has also continued higher to levels that recently supported higher prices.
Looking at the short term view of the ST Indicator, a spike higher in the Smart Beta P/C early in the week was more supportive of a rally than Friday's close.
While the VXX $ volume spiked high enough to give a ST BUY. This indicator and the NDX 3x ETFs (shown below) are the only remaining indicators supporting higher prices.
For the NDX, the SQQQ/TQQQ ratio has pushed high enough to to push prices higher for the next week or two.
For bonds (TNX) sentiment continues to hover near neutral.
For the gold miners (HUI), bearish sentiment continues to weaken, providing less support for a rally.
II. Options Open Interest
The next two weeks show some promise of upside which makes me feel that some progress on the tax plan may be on the table. The combined puts for Wed and Fri should put strong upward pressure up to SPY 259.5 for Wed (SPX 2596) with only small call resistance at higher levels.
While for Fri, strong call resistance should cap any advance at SPY 259.
For the last week of Nov, the weekly pattern is somewhat reversed with Wed (not shown) showing strong call resistance at 259, while for Fri strong put support is seen up to SPY 259.5 with little call resistance over 260. A late week push over SPY 260 seems likely.
Conclusions. Last weeks was a little weaker than expected and seems to have put off the timeline for SPX 2600 by a week to Dec 1 approx. The SKEW is also lagging the topping pattern. The higher bearish sentiment (VXX $ vol) and options open int are now providing a higher confidence trade for higher SPX prices
Weekly Trade Alert. Look for a long in SPX Mon at 2580 or better with a target of 2600+ by Dec 1. Tight stops at SPX 2575 or -5. Updates @mrktsignals.
Investment Diary, update 2017.10.28, Indicator Primer
Article Index 2017 by Topic
Article Index 2016 by Topic
© 2017 SentimentSignals.blogspot.com
I. Sentiment Indicators
I am probably as frustrated as anyone by the lack of clear market direction, but much of the markets ambivalence is due to uncertainty about the tax proposal and its possible that a short term pop happens with the Senate passing their plan, but that a compromise plan with the House may not be agreed upon for several months.
The overall Indicator Scoreboard continued its push back to neutral so there is little to indicate a preferred market direction.
The Short Term Indicator (VXX $ volume and Smart Beta P/C) has also continued higher to levels that recently supported higher prices.
Looking at the short term view of the ST Indicator, a spike higher in the Smart Beta P/C early in the week was more supportive of a rally than Friday's close.
While the VXX $ volume spiked high enough to give a ST BUY. This indicator and the NDX 3x ETFs (shown below) are the only remaining indicators supporting higher prices.
For the NDX, the SQQQ/TQQQ ratio has pushed high enough to to push prices higher for the next week or two.
For bonds (TNX) sentiment continues to hover near neutral.
For the gold miners (HUI), bearish sentiment continues to weaken, providing less support for a rally.
II. Options Open Interest
The next two weeks show some promise of upside which makes me feel that some progress on the tax plan may be on the table. The combined puts for Wed and Fri should put strong upward pressure up to SPY 259.5 for Wed (SPX 2596) with only small call resistance at higher levels.
While for Fri, strong call resistance should cap any advance at SPY 259.
For the last week of Nov, the weekly pattern is somewhat reversed with Wed (not shown) showing strong call resistance at 259, while for Fri strong put support is seen up to SPY 259.5 with little call resistance over 260. A late week push over SPY 260 seems likely.
Conclusions. Last weeks was a little weaker than expected and seems to have put off the timeline for SPX 2600 by a week to Dec 1 approx. The SKEW is also lagging the topping pattern. The higher bearish sentiment (VXX $ vol) and options open int are now providing a higher confidence trade for higher SPX prices
Weekly Trade Alert. Look for a long in SPX Mon at 2580 or better with a target of 2600+ by Dec 1. Tight stops at SPX 2575 or -5. Updates @mrktsignals.
Investment Diary, update 2017.10.28, Indicator Primer
Article Index 2017 by Topic
Article Index 2016 by Topic
© 2017 SentimentSignals.blogspot.com
Saturday, November 11, 2017
Was Last Week a Wobble?
Monday of the first full week of Nov saw a sharp drop in bearish sentiment similar to the week after Oct options exp, but the big difference was the immediate decline in the SPX. A continuation of low bearish sentiment for a few days would have been an identical setup to what was seen in Nov 2015 before the SPX dropped 100 pts, but last weeks decline woke up the bears and will likely extend the timeline for a larger decline for a couple of weeks.
I. Sentiment Indicators
The overall Indicator Scoreboard saw a sizable jump in bearishness, only slightly less than that of the SPX 34 pt drop two weeks ago which was followed by a 50 pt rally.
The Short Term Indicator (VXX $ volume and Smart Beta P/C) bounced off its lows early in the week, but has maintained a downward bias. The next decline should put us near the Nov 2015 lows.
The Smart Beta P/C (ETF puts/Equity calls) narrowly misses the Nov 2015 sentiment lows which may be why the SPX reacted immediately early in the week.
The VXX $ volume indicator has still refused to fall below the 80% of avg level, but the reaction high this time was much less, so the ideal 65% level is in sight.
First looking at a couple of the equity ETFs, the SPX has been moving steadily upwards since the extreme lows of mid-Oct. Comparing the trend to Aug and Nov-Dec of 2015, bearish sentiment had started to rise weeks before the sharper declines, so this may be a "smart money" play.
The NDX ETFs SQQQ/TQQQ bearish sentiment has increased to a moderately strong BUY, supporting my thesis that a move higher to about 6700 is possible. Note that this indicator did give a SELL at the Nov 2015 top.
For bonds (TNX) sentiment is somewhat an enigma since the basing period in mid-2016 saw bearish sentiment rise the same time as rates (possible "smart money"). The current pattern is much the same as mid-2016, so we may see rates rising along with sentiment.
As to the gold miners (HUI), the consolidation of sentiment below the neutral area may be a warning of what we saw in very early 2015, just before prices collapsed.
II. Options Open Interest
This week, I am going to take a look at just the SPY monthlies for Nov and Dec. First for the Nov exp, the "most likely" is 257 (11/10 close 258), but with the uptick in bearish sentiment from 258 the upside resistance is not difficult to overcome and there is strong put support above 255.
Looking to Dec exp, the large call resistance should overpower puts pushing prices below SPY 255 and the low level of put support indicates a possible drop to the SPY 250 level with "most likely" at 254.5.
III. Technical Indicators
I haven't talked about this indicator for most of 2017, but for much of 2015-16 I was using the $SKEW as a price change indicator where large values (142+) usually indicated large price moves ahead. The current period looks a lot like June to me. First, it indicates low chances of a large price move, but also during that period we saw a two week period with a sideways wobble ending with a pop and drop of about SPX 2%. This aligns with both sentiment and opt open int with a choppy upward bias into Black Friday then a 2-3% pullback into mid-Dec.
Conclusions. Last weeks drop in ST sentiment lead to a sharp intra week drop of SPX 30 pts which is now pointing to a very short term rally, but the overall downward trend in bearish sentiment is indicating something larger soon. Both SKEW and options open int indicate that when the next rally ends, the direction will be down for the SPX into mid Dec, probably due to a Fed rate hike. Depending on sentiment, the current NDX ETF points to higher prices, so there will probably be a year-end rally into Jan earnings, stronger for the NDX than SPX.
Weekly Trade Alert. There will probably a 20+ pt rally in the SPX over the next two weeks, but likely choppy and hard to trade. Wait for SPX 2600+ to short around Black Friday. Updates @mrktsignals.
Investment Diary, update 2017.10.28, Indicator Primer
Article Index 2017 by Topic
Article Index 2016 by Topic
© 2017 SentimentSignals.blogspot.com
I. Sentiment Indicators
The overall Indicator Scoreboard saw a sizable jump in bearishness, only slightly less than that of the SPX 34 pt drop two weeks ago which was followed by a 50 pt rally.
The Short Term Indicator (VXX $ volume and Smart Beta P/C) bounced off its lows early in the week, but has maintained a downward bias. The next decline should put us near the Nov 2015 lows.
The Smart Beta P/C (ETF puts/Equity calls) narrowly misses the Nov 2015 sentiment lows which may be why the SPX reacted immediately early in the week.
The VXX $ volume indicator has still refused to fall below the 80% of avg level, but the reaction high this time was much less, so the ideal 65% level is in sight.
First looking at a couple of the equity ETFs, the SPX has been moving steadily upwards since the extreme lows of mid-Oct. Comparing the trend to Aug and Nov-Dec of 2015, bearish sentiment had started to rise weeks before the sharper declines, so this may be a "smart money" play.
The NDX ETFs SQQQ/TQQQ bearish sentiment has increased to a moderately strong BUY, supporting my thesis that a move higher to about 6700 is possible. Note that this indicator did give a SELL at the Nov 2015 top.
For bonds (TNX) sentiment is somewhat an enigma since the basing period in mid-2016 saw bearish sentiment rise the same time as rates (possible "smart money"). The current pattern is much the same as mid-2016, so we may see rates rising along with sentiment.
As to the gold miners (HUI), the consolidation of sentiment below the neutral area may be a warning of what we saw in very early 2015, just before prices collapsed.
II. Options Open Interest
This week, I am going to take a look at just the SPY monthlies for Nov and Dec. First for the Nov exp, the "most likely" is 257 (11/10 close 258), but with the uptick in bearish sentiment from 258 the upside resistance is not difficult to overcome and there is strong put support above 255.
Looking to Dec exp, the large call resistance should overpower puts pushing prices below SPY 255 and the low level of put support indicates a possible drop to the SPY 250 level with "most likely" at 254.5.
III. Technical Indicators
I haven't talked about this indicator for most of 2017, but for much of 2015-16 I was using the $SKEW as a price change indicator where large values (142+) usually indicated large price moves ahead. The current period looks a lot like June to me. First, it indicates low chances of a large price move, but also during that period we saw a two week period with a sideways wobble ending with a pop and drop of about SPX 2%. This aligns with both sentiment and opt open int with a choppy upward bias into Black Friday then a 2-3% pullback into mid-Dec.
Conclusions. Last weeks drop in ST sentiment lead to a sharp intra week drop of SPX 30 pts which is now pointing to a very short term rally, but the overall downward trend in bearish sentiment is indicating something larger soon. Both SKEW and options open int indicate that when the next rally ends, the direction will be down for the SPX into mid Dec, probably due to a Fed rate hike. Depending on sentiment, the current NDX ETF points to higher prices, so there will probably be a year-end rally into Jan earnings, stronger for the NDX than SPX.
Weekly Trade Alert. There will probably a 20+ pt rally in the SPX over the next two weeks, but likely choppy and hard to trade. Wait for SPX 2600+ to short around Black Friday. Updates @mrktsignals.
Investment Diary, update 2017.10.28, Indicator Primer
Article Index 2017 by Topic
Article Index 2016 by Topic
© 2017 SentimentSignals.blogspot.com
Subscribe to:
Posts (Atom)