A series of financial panics in the US starting in the late 1800s, including the 1893 and 1896 depressions, the 1901 railroad share panic and the panic of 1907 that resulted in a 50% decline in the NYSE, contributed to the gathering of banking leaders on Jekyll Island the Fall of 1910. The result was establishment of a national bank of last resort to centralize the US flow of banking reserves and it became known as the Federal Reserve System. Things to seemed to work well for 19 years increasing complacency and public confidence in the stock markets until the blowoff in the fall of 1929 led to the markets crash and the depression of the 1930's.
The main reason for the history lesson is that even before the advent of Covid-19, markets were showing a similar pattern of behavior, only needing a spark to start a blazing fire. 19 years after the the 1981 recession we had the tech bubble and crash, and 19 years after 9/11 2001 we had the Trump everything bubble with overwhelming investor complacency based on the belief that the Fed can prevent or fix all catastrophes, but what if they can not?
Speaking of complacency, you would think that following the worse ST decline in stocks, including 1929, that investors would be lining up around the block to sell their stocks the same way they are lining up to buy bread and toilet paper because of Covid-19, but last week actually saw a reduction in fear as DM seems to be convinced that BTFD is now the way to go after panicking in Feb 2018 and Dec 2018.
I. Sentiment Indicators
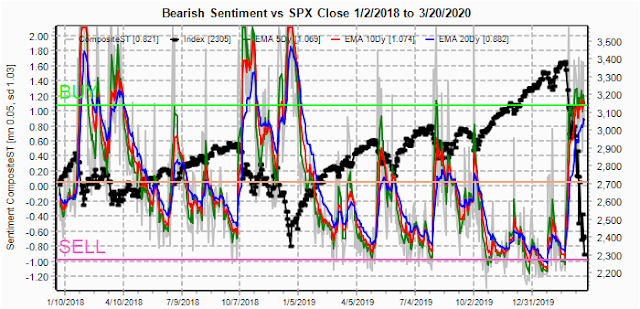
The overall Indicator Scoreboard (INT term, outlook two to four months) bearish sentiment has now reached the level seen at the Oct 2018 lows that may support a trading range before lower lows/retest.
The INT view of the Short Term Indicator (VXX $ volume and Smart Beta P/C [ETF Puts/Equity Calls], outlook two to four months) bearish sentiment remains significantly below either the Feb or Oct 2018 lows, indicating more volatility ahead.
Taking a closer look at the VXX $ volume indicates that most of the complacency in the ST indicator is the lack of belief in higher volatility and may result in a VIX of 100 or more before a final bottom.
Bonds (TNX). Interest rates are starting to show extreme volatility. As measured by the TLT that reached a high of 180 this week from a 120 low a year ago, prices dropped as low as 144 during the week before closing at 159.
For the INT outlook with LT still negative, the gold miners (HUI) bearish sentiment rose from the extreme lows two weeks ago to about half way to neutral with prices closing near the lows for the week.
II. Dumb Money/Smart Money Indicators
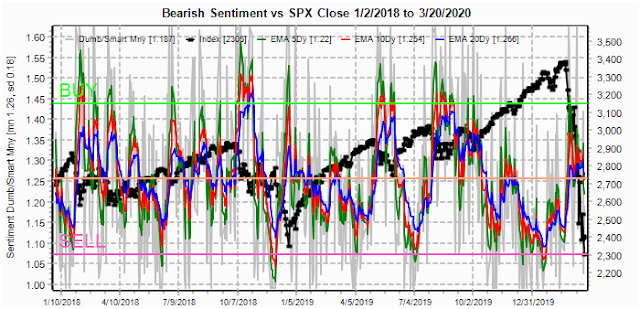
The option-based Dumb Money/Smart Money Indicator as short/INT term (outlook 2 to 4 mns/weeks) turned lower for the week, dropping below neutral as the DM seems to be expecting a near-term bottom (SPX 2250-2350).
And the sister options Hedge Ratio sentiment is similar, again a sign of complacency especially given the selloff of 30% over the last few weeks.
This week I want to continue to follow the INT term SPX Long Term/Short Term ETFs (outlook two to four wks/mns) bearish sentiment (2x DM/3x SM) saw a sharp drop as the DM (2X) is now buying (BTFD) while SM has similar selling. The result was a sharp drop in sentiment, and is likel;y warning of lower prices ahead. NDX SM/DM shows similar sentiment.
III. Options Open Interest
With recent volatility extremes, SPX charts are of little use.
Using the GDX as a gold miner proxy closing at 20.55, two weeks ago the charts showed little put support below 25, and once support was broken a free fall occurred down to as low as 16.2 on Mon before rebounding. Looking at the Apr 17 exp, optn positions are very light compared to the previous 50-60K calls in the 35 range and negative delta hedging is likely. Only relevant support/resistance areas are 17 below and 23-24 above.
Currently the TLT is 159 with the TNX at 0.9%. After dropping to put support at 145, TLT rallied sharply thru weak overhead resistance.
IV. Technical / Other
Last week was weaker than expected and the 38% retrace may have been the one day rally in ES from Sun night lows of 2400 to Mon 2700 high. To get an idea of how oversold the SPX is, I want to review the NYSE McClellan Summation Index from 2005. We are now so oversold at -1183 that it is considered a crash warning (<-1000). The last two times this occurred was the Dec 2018 lows and July 2008. Sentiment was showing a strong BUY at the Dec lows, but not today so I am going to focus on July 2008.
What did the market do in July 2008? The SPX consolidated for two months to work off bearish sentiment and allow DM to BTFD before an even larger decline into Dec. This is consistent with investors outlook today where a "wait and see" attitude is taken to see if Covid-19 gets better (as China is already claiming) and if the extraordinary stimulus works its magic. But current sentiment is pointing to the less favorable outcome.
Conclusions. There are some indications that the first downward thrust may be nearing completion (aka Oct 2018), while DM BTFD indications are pointing to a somewhat weak rebound similar to Jul-Aug 2008 of a 10% range of maybe SPX 2250-2500. If notable economic improvement is not seen by the end of the 2nd Qtr, a big slide may be seen into the election.
Weekly Trade Alert. None. Updates @mrktsignals.
Investment Diary,
Indicator Primer,
update 2020.02.07 Data Mining Indicators,
update 2019.04.27 Stock Buybacks,
update 2018.03.28 Dumb Money/Smart Money Indicators
Article Index 2019 by Topic, completed thru EOY 2020.02.04
Article Index 2018 by Topic
Article Index 2017 by Topic
Article Index 2016 by Topic
Long term forecasts
© 2020 SentimentSignals.blogspot.com


This comment has been removed by a blog administrator.
ReplyDelete