
Sentiment indicators are still conforming to the Oct 2018 setup, but still seem likely to play out over a longer time frame thru the EOY. Next week looks like a retest of the SPX 2850s is likely by mid-week with a rally to EOM at SPX 3100+ to follow. So far the 50% retracement level from the Feb high/lows (3124) has proved elusive with Wed close at 3130 and Tue brief spike to 3139. Bearish sentiment in the overall and ST composites indicate that the volatility is just beginning, while record sentiment in the INT 2x ETF SPX and NDX show that limited downside (SPX 2600) is likely for the next several months.
I. Sentiment Indicators
The overall Indicator Scoreboard (INT term, outlook two to four months) bearish sentiment has risen sharply since late Feb but has only reached the level of the first down leg in Oct 2018, truly a scary thought given the relative size of the decline.

The INT view of the Short Term Indicator (VXX $ volume and Smart Beta P/C [ETF Puts/Equity Calls], outlook two to four months) bearish sentiment has risen only moderately higher than seen in Aug 2019. Again, an amazing amount of complacency probably due to faith in the Fed's ability to solve all problems by printing money as well as Trump's probable re-election over the less that stellar Dem front runners.

Bonds (TNX). Somebody has to be wrong as bond investors seem to believe the end of the world is coming and at the current pace rate will reach 0% in two weeks time, while stock sentiment is giving the "all clear" signal.

For the INT outlook with LT still negative, the gold miners (HUI) bearish sentiment remains near record lows as gold stocks are under performing gold which jumped on the surprise rate cuts which resulted in dumping of the dollar.

II. Dumb Money/Smart Money Indicators
The option-based Dumb Money/Smart Money Indicator as short/INT term (outlook 2 to 4 mns/weeks) and the Hedge Ratio below are the two most disconcerting indicators, reaching about the same level as the Sept 2018 pullback before the Oct high. If we do see a retest of the lows next week near SPX 2850 followed by a rally to the mid 3100s by late Mar, a SELL is likely pointing to the 2600s as the next target.

And the sister options Hedge Ratio sentiment has shown the weakest rise in bearish sentiment, remaining lower than any of the previous rallies over the last two years. Along with the ST Composite much more volatility is to be expected.

The INT term SPX Long Term (2x/DM) ETFs (outlook two to four weeks) bearish sentiment for the ETFs, in contrast to other indicators, has seen the strongest rise in bearish sentiment. This may be due to flight to safety by switching to bonds, but since this tends to be longer term compared to options, it is the main reason the correction may stretch out over most of the year with the biggest damage in the Fall.

The INT term NDX Long Term (2x/DM) ETFs (outlook two to four weeks) bearish sentiment has seen an almost identical rise to the SPX ETFs with same conclusions..

III. Options Open Interest
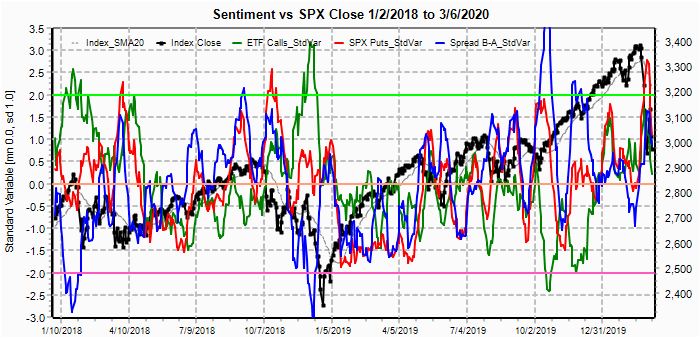
Using Thur closing OI, remember that further out time frames are more likely to change over time, and that closing prices are more likely to be effected. Delta hedging may occur as negative reinforcement when put support is broken or call resistance is exceeded. The SPX hedge spread (SPX puts - ETF calls) moderately positive, indicating that put support should hold. This week I will look out thru Mar 13 with an expanded range from 2800 to 3200. Also, This week includes a look at the GDX for Mar exp.
With Fri close at SPX 2972, options OI for Mon is small with very few calls below 3040 and almost all puts below 3000. Delta hedging may cause downward pressure, but rallies could be dynamic. No clear direction.

Wed is pretty much the same. No clear direction with downside potential to SPX 2800 and upside to 3060.

For Fri, large OI is likely to provide more upside pressure from put support where a hold over SPX 2900 could extend to 3060.

Using the GDX as a gold miner proxy closing at 29.4, even with gold pushing higher to 1680, GDX has been caught between put support at 27 and call resistance at 30. This month even much stronger call resistance was added at 32 to 34.

Currently the TLT is 166.8 with the TNX at 0.71%.
IV. Technical / Other
Just a quick look at two of the data mining indicators. First, the Crash Indicator that has improved sharply, but also very much like the Oct 2018 period, indicating that a tradeable bottom is near.

Secondly, the SPX hedge spread (SPX puts/ETF calls), indicating that put support is more likely to hold.
Conclusions. I am sure may were disappointed that I exited early, turning cautiously bearish on Dec 21 with the SPX at 3220 that resulted in missing about 5% of a 40% rally from 2350, but since I caught the exact bottom and foresaw a risk of a 30-40% loss back to 2000-2200s, the risk/reward was not worth it. With the SPX now at 2970, that still seems like a prudent decision. Sentiment works much better at timing bottoms than tops.
The next few weeks now show the potential for gaining an additional upside of about SPX 300 pts on a retest of the lows at 2850 to about 3150 to be followed by another possible downdraft of about 500 pts to 2600.
Weekly Trade Alert. Mon-Wed amy show some weakness after the Thur-Fri selloff of SPX 200 pts. A retest of the Feb lows at SPX 2855 should be a buying oppty thru EOM Mar, early Apr with a target of 3100-50. Unless there is a miraculous turnaround of China production, earning guidance for Q2 in Apr is likely to take a strong hit and could take the SPX to 2600s. Updates @mrktsignals.
Investment Diary, Indicator Primer,
update 2020.02.07 Data Mining Indicators,
update 2019.04.27 Stock Buybacks,
update 2018.03.28 Dumb Money/Smart Money Indicators
Article Index 2019 by Topic, completed thru EOY 2020.02.04
Article Index 2018 by Topic
Article Index 2017 by Topic
Article Index 2016 by Topic
Long term forecasts
© 2020 SentimentSignals.blogspot.com
No comments:
Post a Comment