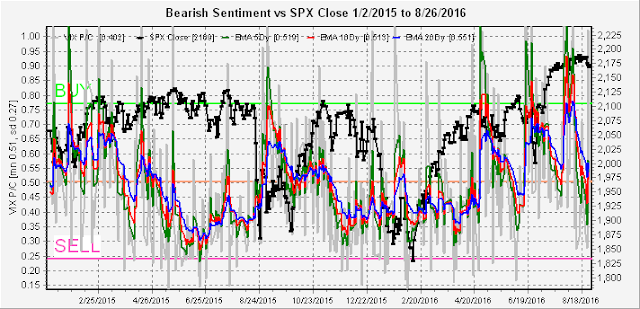
Last weeks forecasted trading range worked out almost perfectly with a high in the SPX mid 2190s followed by a drop to 2160, but I missed the entry point for a short by three points. Overall bearish sentiment has become less extreme, allowing for a continuation of the rally (early 2015 scenario). The key for the next week to ten days are the unemployment numbers on Friday. A repeat of the strength last month will increase the likelihood of FED tightening. I always look at the FRED's Initial (Unemployment) Claims/1 year chart as an indicator, high claims means lower jobs numbers and that is exactly what happened last month. So this report may be just right to support a rally back to the SPX 2200 level.
For this week's sentiment indicator review, I will only cover the overall Indicator Scoreboard, the Short Term Indicator (VXX $ vol & Smart Beta P/C), and the VIX P/C. There were 5 to1 splits in both the NUGT and DUST ETFs last week, so I need to do another smoothing algorithm and will report the results next week.
The Indicator Scoreboard continues to show a similar pattern to the topping pattern of early 2015, only this time the over bullishness is even more extreme.
The Short Term Indicator shows a similar pattern only to a less extreme and does not indicate a final top.
The VIX P/C briefly dropped close to the .35 level early last week before the decline showing the effectiveness of this indicator, and then bounced back at the end of the week.
Conclusion. The bankers seem intent on maintaining a sense of calmness going into the election, but will this be only a calm before the storm.
Weekly Trade Alert. I will be going long SPX on a retest of 2160 early in the week with a target around 2200 over the next two weeks with a 15 pt stop.


No comments:
Post a Comment