
I. Sentiment Indicators
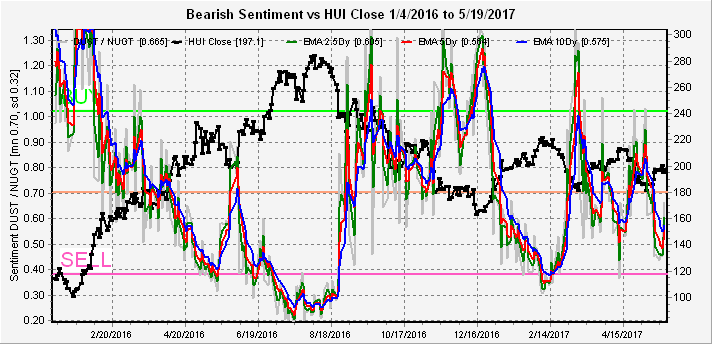
Tuesday saw a sharp drop in bearish sentiment putting both the overall Indicator Scoreboard and the Short Term Indicator in the SELL position, but the action of the next few days resulted in a sharp reversal in sentiment.


The Short Term Indicator (VXX $ volume and Smart Beta P/C) using S/T EMAs has also given a short term BUY, with the huge spike in VXX volume, which recently has resulted in new highs.

To make matters more interesting, the very short term outlook for the BKX which had been leading the DJIA down and last week saw many analysts project short term lows in the 74-5 range now shows a BUY. Opposite to the Feb-Mar period which was mostly in the SELL range, the multiple BUYs now could indicate continued strength.

pre-Conclusion for SPX. Admittedly my personal bias is bearish longer term and a longer topping period with the semblance of a H&S is my hope, but I rely on sentiment for shorter direction. That being said, I weight the immediate drop to SPX 2300ish at only 10% with a move to 2400 before dropping at 45% and to 2415 also at 45%.
Looking at bonds (TNX) a drop in rates to the bottom of the recent trading range has only resulted in a small reduction in bearish sentiment, so still neutral in direction.

For the gold miners (HUI), it looks like higher prices are still ahead as sentiment has not yet dropped to the SELL level.
II. Using Option Open Interest (OI)
For over a year I had been reading the free weekend updates of SassyOptions so I am not sure why this week I decided to try my own, but after recommending the weekend report on Twitter, I set up a spreadsheet version in Excel posting several updates online Mon & Tue.
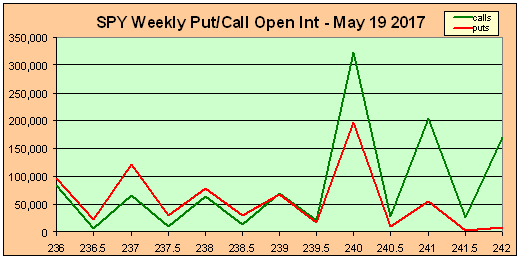
The first chart I set up was for the May monthly (wrong in title) option interest for the SPY. The chart indicates the puts (red) were pushing upwards to 240 while the calls (green) were pushing downward with convergence at 240. These act much like the EW pivot points or as support/resistance zones. As prices continued to hold around 240 on Tue, I noticed a put/call imbalance for Wed/Fri with p/cs at .76 and 1.1 respectively, so I expected a 5-10 pt drop for SPX Wed then a rally back to 2400 (SPY 240) Fri. At 8am EST on Wed futures were down 6-7 pts and held there to 8.30, so I thought I had guessed right, but when the east coast banks opened at 8.30am futures started dropping and quickly fell to down 20. What I had failed to realize was that there was no support below SPY 240 and after opening quickly dropped to 237 with the SPX closing at 2357. What happened was something called "delta hedging" which is simply a form of portfolio insurance, aka 1987, where a drop below a certain range that seemed to be 8-10 SPX pts forced the put writers to sell SPX futures to cover their losses which started a downward spiral in prices.
Why did it stop at SPX 2353 on Tue? This is an updated chart of the one posted on Twitter for June that shows strong support at the SPY 235 (SPX 2350) level. However, there is virtually no put support above 235 and below that no support until 230, so for June expy the expected range is 235-240, but a break below 235 could quickly fall to 230.

Next I want to look at next weeks Wed/Fri OI, remembering that contract size for Fri is about 50% of monthly and Wed is about 50% of Fri so influence is probably relative to contract size.
For Wed, convergence is at 239 with stronger call resistance above and less put support below so most likely range thru Wed is 238-39.

Fri tells a completely different story with strong put support at 237 and 239 while call resistance actually declines between 240.5 and 241.5, indicating that this is the best chance for a move higher to SPX 2405-2415 range.

pre-Conclusion for SPX. OK, so there is no guarantee this will actually work, but it does look like there is a good possibility for a short entry Fri at a new ATH with a good chance of a decline to 2350 or if broken 2300 by June expy.
Application for the NDX using QQQ ETF. This is an interesting example of "delta hedging" both ways. Using the May OI, the QQQ should have been pegged to 138, but once it broke to the upside, there appeared to be no limit. I began to think the NDX would continue rising until Musk announced plans to build a solar powered escalator to the moon.

The June OI tells a different story, as the Wed drop sent the QQQ all the way from the above call resistance down to the below put resistance.

I also tried a couple of others including the TNX, VIX and GDX. There were no options for TNX, VIX was interesting with a medium size hump at 12 and a larger one at 15 which turned out to be key levels, but somehow the chart disappeared. So the following is for the GDX June. There is strong resistance at 24 and above with max put support at 22, so most likely range 22-24. Watch out for delta hedging below 20.

III. Conclusions.
So we covered two sentiment approaches this week, my normal approach does not show a clear path with a short term BUY and an intermediate stronger SELL. One resolution which I posted on Twitter is an analog to mid-June 2016 when we had a similar sharp rise in VXX volume. What is shown is the EW preferred scenario where sentiment spiked high enough on the second decline (now SPX 2300 or below) to support a rally to ATH. Possible, but I prefer a more bearish LT resolution which would probably mean alternation (we had sharp decline, so next phase more gradual) or an ATH and consolidation to work off bearish sentiment then decline.

The use of option open interest supports the bearish outcome as a possibility with a possible rally late next week over SPX 2400 with more decline later into June.
Weekly Trade Alert. This even harder than last week which did turn out to be the correct path. Assuming SPX consolidates between 2380-90 Mon-Wed, a run above 2400 Thu-Fri seems likely as bears get antsy. Short SPX 2415ish, Stop 2425. Target ST 2350, IT 2300. Updates @mrktsignals.
Article Index 2017 by Topic
Article Index 2016 by Topic
© 2017 SentimentSignals.blogspot.com
whats the best email to contact you> i have some questions with regards to teh open interest. Im trying to understand how to interpret it. I was looking at the June expiration for IWM. What do you see?
ReplyDeleteThanks