
I. Sentiment Indicators
Today, I am taking a long term look (back to 2015) for all sentiment indicators as my long term view is that removal of the extraordinary central bank support for the economy will have long term effects on most of the markets. Think 1970s with deflation instead of inflation.
The overall Indicator Scoreboard saw a slight bounce in the shorter EMAs with concern over the FOMC, but longer term still working downwards.

The Short Term Indicator (VXX $ volume and Smart Beta P/C) also leveled off short term, indicating that higher prices may be required as we saw in April of 2015.

The VXX $ volume continues to amaze me as the bears seem to have focused on the record lows in the VIX with dreams of a potential rise to the 50 to 100 level. Unless an improvement is seen here, we may see the topping process stretch out for months. This does support the idea of a 1970-72 bear market longer term where it took two years for prices to fall 20%, think of two years where every 6-8 weeks we had a 3% decline followed by a 2% rally (much like the reverse of 2017).

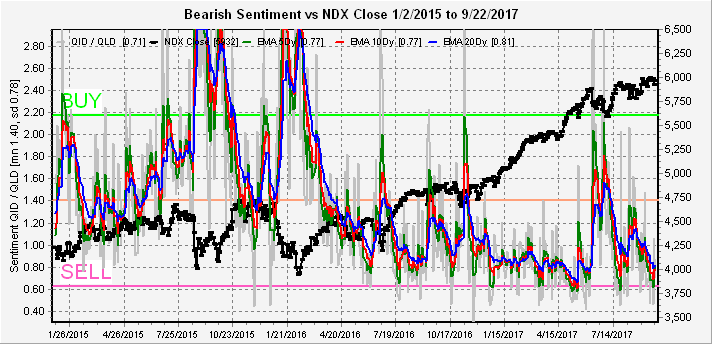
Using the Short/Long ETFs for both SPX and NDX we can see that there is little money flow support for higher prices (pointing to limited upside) as both traders (SPXU/UPRO, and TQQQ/SQQQ) and investors (SDS/SSO and QID/QLD) are mostly all in.


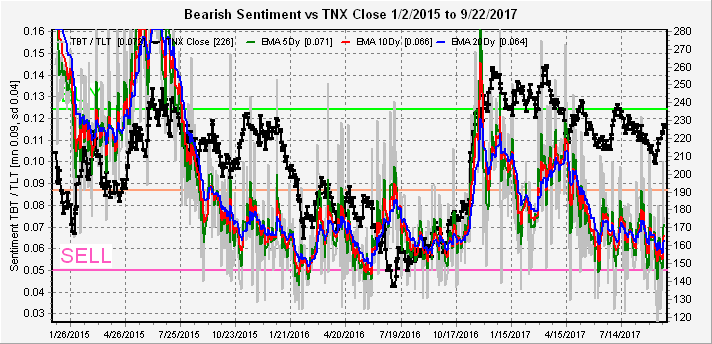
Moving on to bonds (TNX) bearish sentiment is nearing the overall levels of mid 2016 which were followed by a sharp rise in rates.
For the gold miners (HUI), the longer term outlook is not much better than bonds.

II. Options & Open Interest
First looking at an update for the VIX Call Indicator, we saw an increase prior to the FOMC, but overall the increase from the lows is about .3 with a SELL at .5. SELLs usually have a 1 to 3 week lead so mid or late Oct still looks probable for a top.

Last week showed one of the problems with relying too much on the options open interest as prices were not as weak as suggested. This is why I recommend the use similar to support resistance zones or as EW pivots with overall sentiment determining strength or weakness. There was, however, another instance of the "new put" phenomenon as outlined in the Investment Diary, update 2017.09.05, (formerly Short Term Trading Observations) when new puts were added to the SPY Wed 22nd open int Mon/Tue and Wed AM saw a high P/C ratio as mentioned in Twitter, but I should have said SPY 248-9 (act 248.9) since I forgot the 1.2 drop in SPY from going ex-div. As a reader commented, updates for the open int are available from Opricot with the low pt of the 3rd chart the most likely pin.
Looking at the options open int charts for next week for the SPY, Wed looks like more of the same with a most likely pin at 249.5 (SPX 2503), but open int is very light.

For Fri, the open int for calls swamps puts and should push prices below SPY 248 and could possibly lead to a fill of the gap in the SPX at 2462. However, Wed is supposed to see a prelim release of the Rep tax plan, so will there be a big disappointment or will ST sentiment keep prices elevated with a possible push to SPY 251?

Conclusions. Again a lack of clarity with overall money flow sentiment pointing to a nearing top but with the ST indicators saying not quite yet. As I pointed out in the past, I have never seen this much enthusiasm for the vol products in a stable market, and the effect on prices is hard to determine. Several indications are that the Rep tax plan may take months to work out, so that may continue to support high stock prices longer than reasonable.
Weekly Trade Alert. Options open int point to a pullback late in the week, but the VIX Call Indicator is unlikely to give a SELL unless Mon-Wed call vol averages 900k+. Also watch for "new puts" as a possible sign. Updates @mrktsignals.
Investment Diary, update 2017.09.05, "new put" support is bearish
Article Index 2017 by Topic
Article Index 2016 by Topic
© 2017 SentimentSignals.blogspot.com
No comments:
Post a Comment