Temperatures are soaring around the globe, just don't call it global warming, as Europe recently saw the highest temperatures ever recorded and California-like forest fires are raging across the Arctic north. The SPX seems to be following suit, as the last two tests of the 2970s in the middle of the week quickly saw a reversal to new highs over 3000.
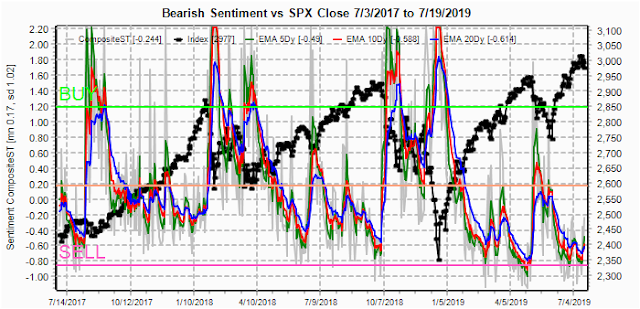
Bearish sentiment is still showing a gradual erosion, not unlike what was seen at the beginning of the Jan 2018 melt up. Last week did see a noticeable pickup in VIX call volume, but not enough to trigger a SELL. Possibly a "sell the news" event after next weeks FOMC, but maybe only 2-3% pullback, more in Tech/Other.
I. Sentiment Indicators
The overall Indicator Scoreboard (INT term, outlook two to four months) bearish sentiment briefly popped up to the same level seen at the end of Dec 2017, so we could be beginning the melt up.
The INT view of the Short Term Indicator (VXX+VXXB $ volume and Smart Beta P/C [ETF Puts/Equity Calls], outlook two to four months) bearish sentiment move to news similar to early Jan 2018 when the melt up began.
Bonds (TNX). Interest rates may have bottomed, which could indicate declining recession fears going forward. As shown in the next chart, bank stocks sold off strongly at the end of 2018 before the interest rate decline, but have recently seen a strong rally that may be forecasting a stronger economy. My outlook for 2.5% GDP growth for 2019 is close for the first 2 qtrs with 3.1% and 2.1% for an avg of 2.6%.
The banking ETFs (FAZ/FAS) have rallied strongly and seem to be breaking out of the downtrend that began early in the trade war with China and seem to be leading the bond market by 6-8 months.
For the INT outlook with LT still negative, the gold miners (HUI) bearish sentiment has reached an extreme based on forecasts of ZIRP and NIRP from the perennial gold pundits, but economic improvement will likely squash those expectations.
II. Dumb Money/Smart Money Indicators
For this week and possibly for the next several months, I am going to replace the DM/SM ETF indicators with other indicators.
The option-based Dumb Money/Smart Money Indicator as short/INT term (outlook 2 to 4 mns/weeks) saw the expected bounce to the neutral level, but slightly weaker than in Dec 2017.
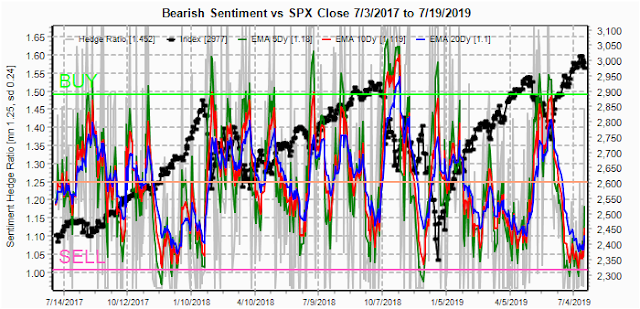
And the sister options Hedge Ratio sentiment only bounced by half as much as Dec 2017 and could indicate a more volatile upward move than seen in Jan 2018.
The INT term SPX Long Term (2x/DM) ETFs (outlook two to four weeks) bearish sentiment has reached a point similar to Aug 2018 that could mean a couple of months of topping pattern ahead.
The INT term NDX Long Term (2x/DM) ETFs (outlook two to four weeks) bearish sentiment has reached a level equal to the late Apr top that may mean relative weakness ahead.
III. Options Open Interest
Using Wed close, remember that further out time frames are more likely to change over time, and that closing prices are more likely to be effected. This week I will look out thru Aug 2. Also, This week includes a look at the GDX for Aug.
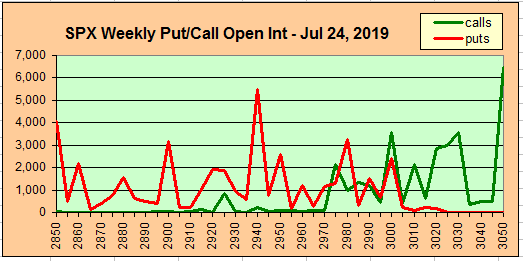
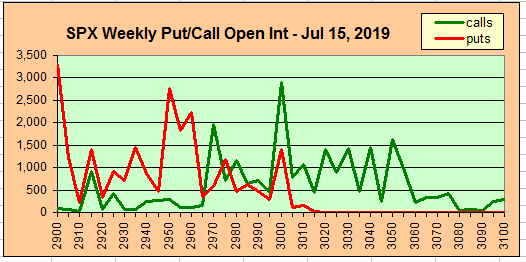
With Fri close at SPX 3026, the SPX is sitting right on resistance and a move toward the 3000 level seems likely. Moderate put support is at 2980.
Wed is FOMC day with most options traders positioned for a rally to SPX 3050 or higher, there is only minor put support at SPX 3000 and 2975 and strong support at 2950. Any disappointment or "sell the news" is likely to drop to 2975 or lower.
Fri is NFP (jobs report) day, so this could be a volatile week. Early week weakness is likely to increase put support at SPX 2975 and 3000 with a second day of large open int. SPX 2975-3000 is the most likely range, but a strong jobs report may repeat the pattern of the last two weeks with a mid-week selloff to the 2970s followed by a late week bounce back over 3000.
Using the GDX as a gold miner proxy. For Aug exp, sentiment is about as lop-sided a it gets with more than 3 times as many calls as puts. With Fri close at $27.28, there is very strong resistance above 27 and only small net put support between 25 and 26.
IV. Technical / Other
I still have not found a way to duplicate the "old" VIX call indicator using the "new" graphics, but the move of 50% of the mean in Aug 2018 ("old" method) was 2.5 SD (-1.5 to 1.0) so I am going to use that as a benchmark. Currently the VIX calls are up about 38% of mean ("old") or 2 SDs in a similar pattern seen in Feb-Apr 2018.
And finally, a look at one of my old time favorites, the long term NYUPV/NYDNV, which shows that a move below 1.5 for the 100 SMA was a warning of a nearing top in June 2015 and Aug 2018, but so far 2019 has held above the line.
Conclusions. Overall, a top of significance seems to be approaching, but may be several months away. Aug-Oct 2018 seems more likely as a topping pattern, ie, volatile rather than straight up as in Jan 2018
Weekly Trade Alert. The SPX sentiment supports a 2-3% pullback following the FOMC as a "sell the news", but is unlikely to be THE top. Options OI indicates a possible volatile week with a possible selloff to the SPX 2970s followed back a rally back to 3000 or higher. Updates @mrktsignals.
Investment Diary,
Indicator Primer,
update 2019.04.27 Stock Buybacks,
update 2018.03.28 Dumb Money/Smart Money Indicators
Article Index 2019 by Topic
Article Index 2018 by Topic
Article Index 2017 by Topic
Article Index 2016 by Topic
Long term forecasts
© 2019 SentimentSignals.blogspot.com
Saturday, July 27, 2019
Saturday, July 20, 2019
Has the Fed Created a Black Hole?
Several years ago when the "QE experiment" was just beginning my view was that QE would become a "roach motel", that is, easy to get in, but hard to get out. That analogy was proven correct, as a mere 10% reduction in the Fed's balance sheet now has financial pundits calling for renewed Fed easing and a return to ZIRP. There also seems to be jockeying for position at the head of the line for the Fed chair succession, as Powell is viewed as a "lame duck" if Trump is re-elected, and some may be showing support of Trump's call for lower rates to curry favor.
Black holes are seen as a source of infinite destruction as matter is sucked in under immense gravitational forces, as well as a source of infinite power, such as the potential to travel across immense distances at faster than the speed of light if a fraction of the power can be harnessed. The markets, especially precious metals, seem to be focused on the power potential, but my feeling is that the Fed may be just building a bigger roach motel.
I. Sentiment Indicators
The overall Indicator Scoreboard (INT term, outlook two to four months) bearish sentiment has increased only slightly, but may be still comparable to Dec 2017 before the Jan 2018 melt up.
The INT view of the Short Term Indicator (VXX+VXXB $ volume and Smart Beta P/C [ETF Puts/Equity Calls], outlook two to four months) bearish sentiment has also seen a comparable move to Dec 2017.
Bonds (TNX) may be seeing a bottoming in interest rates with very low sentiment.
For the INT outlook with LT still negative, the gold miners (HUI) bearish sentiment has fallen off a cliff as prices have gone parabolic. This does not typically end well, as seen in the crypto market several years ago.
II. Dumb Money/Smart Money Indicators
For this week and possibly for the next several months, I am going to replace the DM/SM ETF indicators with other indicators.
The option-based Dumb Money/Smart Money Indicator as short/INT term (outlook 2 to 4 mns/weeks) saw a sharp rise back to the neutral level, so far matching Dec 2017.
And the sister options Hedge Ratio sentiment is sharply lagging as there is still little hedging support and probably indicates more downside in the future.
The INT term SPX Long Term (2x/DM) ETFs (outlook two to four weeks/mns) bearish sentiment is also relatively unchanged, and as more of an INT indicator contradicts the melt up scenario.
The INT term NDX Long Term (2x/DM) ETFs (outlook two to four weeks/mns) bearish sentiment also remains very low. Last weeks warning of lower bearishness than the SPX pointing to under performance proved correct as the NDX was down 2% vs 1% for the SPX. This week sentiment is similar, so performance is likely to be the same.
III. Options Open Interest
Using Wed close, remember that further out time frames are more likely to change over time, and that closing prices are more likely to be effected. This week I will look out thru Jul 26. Also, This week includes a look at the TLT thru Jun.
With Fri close at SPX 2977, Mon is slightly positive with strong support at 2950, but open int is small.
Wed is similar with a likely range of SPX 2880 to 3000.
For Fri, the open int is large but there is much overlap between SPX 2925 and 3000. I calculated the wtd avg of puts that showed support at 2945 and call resistance at 2985, so 2950-80 is the most probable range.
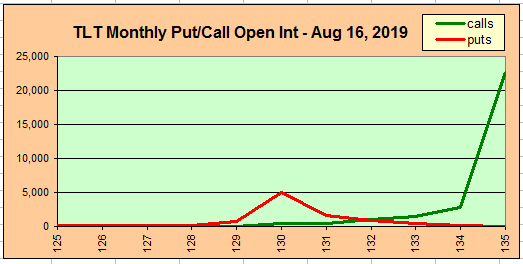
Currently the TLT is 131.7 with the TNX at 2.5%. Last weeks GDX showed little call resistance over 25 that may have contributed to the price run up, amd this week TLT is the opposite with very little put support if 130 is broken to the downside thru Aug 16.
IV. Technical / Other
I am still 50/50 regarding the melt up vs rounded top scenarios and this week I will look at a combination as a result of what appears to be an ending diagonal in the SPX with 3 waves complete. Here we could see a pullback to SPX 2850-2900 by early Sept, then a final rally into late Oct-mid Nov to 3050-3100.
The Smart Beta P/C components seem to bear this out as the 10 day SMA of Equity calls reached the same level as the Apr high with ETF puts almost matching the May lows.
Conclusions. Although I can't rule out Fed craziness as currently seen in the precious metals, the last two weeks showed strong pickups in the jobs report and the Philly ISM that may cause the Fed to disappoint. However, we have seen almost two years of disappointments with the China trade agreement and the markets don't seem to care. The scenario listed under Tech/Other seems most likely.
Weekly Trade Alert. More volatility but not strong bias is likely to present difficult trading. I am still completing my side projects, so hopefuly won't miss much. Updates @mrktsignals.
Investment Diary, Indicator Primer, update 2019.04.27 Stock Buybacks, update 2018.03.28 Dumb Money/Smart Money Indicators
Article Index 2019 by Topic
Article Index 2018 by Topic
Article Index 2017 by Topic
Article Index 2016 by Topic
Long term forecasts
© 2019 SentimentSignals.blogspot.com
Saturday, July 13, 2019
Bulls Gone Wild
Last weeks price action powered thru overhead SPX call resistance to make it over the 3,000 mark. The equity call levels of the Smart Beta P/C are now approaching +1.5 SD seen at the May top (see Tech/Other), while the options DM/SM and Hedge Ratio indicators show that some degree of pullback is likely before the final melt up.
I. Sentiment Indicators
The overall Indicator Scoreboard (INT term, outlook two to four months) bearish sentiment continues to fall sharply as stocks appear to enter a melt up phase.
The INT view of the Short Term Indicator (VXX+VXXB $ volume and Smart Beta P/C [ETF Puts/Equity Calls], outlook two to four months) bearish sentiment has also reached its second lowest level compared to the Apr 2019 SPX top.
Bonds (TNX). Interest rates appear to be bottoming with very low sentiment. The CPI core inflation level rose over the Fed's 2% target with corn (up 12%) leading the way.
For the INT outlook with LT still negative, the gold miners (HUI) bearish sentiment remains extremely low, but Trump's talk of lowering the US $ has added strength to golds demand.
II. Dumb Money/Smart Money Indicators
For this week and possibly for the next several months, I am going to replace the DM/SM ETF indicators with other indicators.
The option-based Dumb Money/Smart Money Indicator as short/INT term (outlook 2 to 4 mns/weeks) has now reached a comparable level to mid-Dec 2017. Combined with the Hedge Ratio, below, it seems like some type of pullback is likely to raise bearish sentiment to neutral before the final melt up phase.
And the sister options Hedge Ratio sentiment is showing an extremely low level of hedging that is likely to lead to a pause/pullback.
The INT term SPX Long Term (2x/DM) ETFs (outlook two to four weeks/mns) bearish sentiment is declining more slowly, indicating that a final top is not likely.
The INT term NDX Long Term (2x/DM) ETFs (outlook two to four weeks/mns) bearish sentiment has fallen more sharply than the SPX ETFs and may lead to relative weakness.
III. Options Open Interest
Using Wed close, remember that further out time frames are more likely to change over time, and that closing prices are more likely to be effected. This week I will look out thru Jul 19. Also, This week includes a look at the GDX.
With Fri close at SPX 3014, put/call open int is much like last week and should prices toward the 2950 level, but may continue to be ineffective in a strong market.
Wed is same as Mon, but a hold over SPX 3000 could push to 3040.
For Fri, I'm looking at the SPY as the monthly PMs have higher open int, but the conclusions are pretty much the same as calls should push prices below SPX 3000, but delta hedging over 3000 could push prices toward 3050.
Using the GDX as a gold miner proxy. now 26.20. For Apr exp, strongest resistance is at 26, so above that there is little resistance.
IV. Technical / Other
Looking at the Smart Beat P/C components, the ETF put levels reached the levels seen at several prior tops, but the Equity call levels are not yet at levels seen at INT tops. The closest similar top is June 2018, where the SPX saw a 100 pt pullback before further advance.
Conclusions. Most of the recent strength in the stock markets is in the large cap DJIA, led by the down-trodden Boeing playing catch up. Comparing to the Jan 2018 melt up, stocks seem to be at mid-Dec 2017, where a consolidation/pullback to reset bearish sentiment to neutral was seen before the final melt up. A longer topping period is still not out of the question.
Weekly Trade Alert. There is really no support for going long except opt exp week, and no reason to short in the short term. Updates @mrktsignals.
Investment Diary, Indicator Primer, update 2019.04.27 Stock Buybacks, update 2018.03.28 Dumb Money/Smart Money Indicators
Article Index 2019 by Topic
Article Index 2018 by Topic
Article Index 2017 by Topic
Article Index 2016 by Topic
Long term forecasts
© 2019 SentimentSignals.blogspot.com
Saturday, July 6, 2019
Will Green Shoots Make the Bulls See Red?
My theme for 2019 has been there would be an economic slowdown the first half of the year that would slow GDP growth from about 3.5% in 2018 to 2.5%, but that signs of an economic recovery, ie "green shoots", would start to appear by mid year. I may have been a little early in my estimate, and certainly wrong about the estimates of a slowdown, as the bond market has discounted another 2008-09 "end of the world" recession. This weeks jobs report, showing a strong rebound in June, was an indication that I may have been right and bonds wrong. But what does this mean for the stock market?
Mario Draghi gave warning that the world's CBs were not going to be as accommodating as the markets expected last Monday when he said the EU would not lower rates in July, and I very seriously doubt the Fed will be any different, especially since the US economy is twice as strong as the EU based on GDP growth and unemployment. For the markets, this raises serious doubts about the melt up scenario and increases the possibility of a 2015-type distribution top that could last into the end of the year.
In the Tech/Other section I will compare the performance of two of the top indicators for the 2015 period. The results may surprise you. For the current market, the SPX certainly looked like a melt up was starting this week, as the SPX "close to 3000" target was hit in three days rather than the three week outlook and now it looks like a small pullback is in progress. If the 2015 distribution top is in play, a 3 to 5% pullback is possible with SPX 3000 replacing the 2100 barrier for 2015.
I. Sentiment Indicators
The overall Indicator Scoreboard (INT term, outlook two to four months) bearish sentiment fell sharply last week to levels that preceded consolidations/pullbacks since mid 2017..
The INT view of the Short Term Indicator (VXX+VXXB $ volume and Smart Beta P/C [ETF Puts/Equity Calls], outlook two to four months) bearish sentiment did not quite reach the levels seen at the Apr 2019 top, and may allow for a final melt up as seen in Dec 2017 or a more immediate correction.
Bonds (TNX). Interest rates may have bottomed with Friday's sharp reversal. If "green shoots" continue to appear a rise in rates should support stocks for the INT term as some bondholders move back into stocks.
For the INT outlook with LT still negative, the gold miners (HUI) extreme bearish sentiment lows also coincided with a sharp price reversal. A less dovish Fed may show that the near vertical rally was a false signal.
II. Dumb Money/Smart Money Indicators
For this week and possibly for the next several months, I am going to replace the DM/SM ETF indicators with other indicators.
The option-based Dumb Money/Smart Money Indicator as short/INT term (outlook 2 to 4 mns/weeks) remains low similar to the Dec 2017 and June 2018 periods.
And the sister options Hedge Ratio sentiment is also at the levels of its most recent extremes.
The INT term SPX Long Term (2x/DM) ETFs (outlook two to four weeks) bearish sentiment has also reached a level seen near recent tops except for the late 2017 period.
The INT term NDX Long Term (2x/DM) ETFs (outlook two to four weeks) bearish sentiment also fell sharply last week with the NDX approaching 8000 and may indicate something like the June 2018 top.
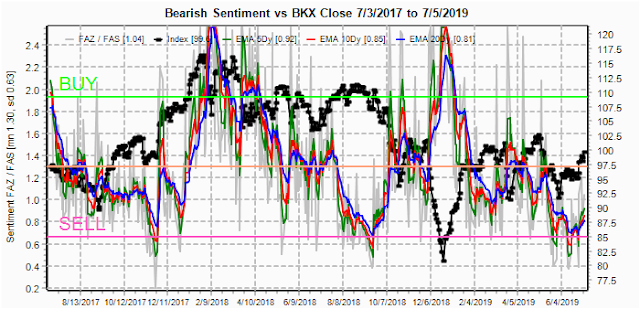
Finally, I also wanted to mention two other sectors, first the small caps (RUT, no chart) which is lagging the SPX and is probably an indication that buybacks, not growth, are supporting the markets. Second, the banking sector (BKX) that is severely lagging and appears to be in a LT downtrend. This sector topped about 6 weeks before the SPX in Sep 2018 after a similar SELL signal, although the Dec 2017 SELL was premature.
III. Options Open Interest
Using Wed close, remember that further out time frames are more likely to change over time, and that closing prices are more likely to be effected. This week I will look out thru Jul 12. This week includes a look at the TLT for Jul 19.
With Fri close at SPX 2990 and moderate open int, there is strong call resistance at 3000 and no put support until 2945. Call hedging may provide some support above 2975.
Wed with light open int, calls may again pressure the SPX toward 2975, but a strong up move could reach 3020.
For Fri large open int is likely to show downward pressure for the week. The SPX is likely to close between 2950-75.
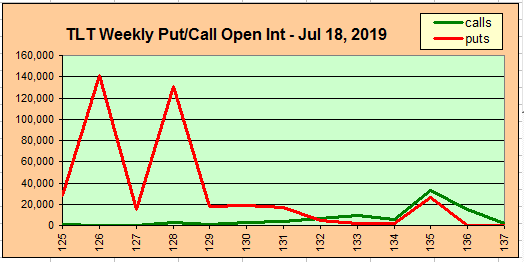
The TLT 20 year bond fund is used as a proxy for interest rates. Currently the TLT is 132.4 with the TNX at 2.05%. There is some put support at 132 with very strong support at 128, some pullback is likely.
IV. Technical / Other
Last week I used a data mining chart to show the Smart Beta P/C components of Equity calls and ETF puts indicated that an SPX melt up may be needed to give a similar topping signal as Jan and Oct 2018, but this week I want to focus on the possibility of a distribution top as seen in 2015. Looking back at mid 2014 to EOY 2015 using the same indicator, there was no final surge in equity call buying, and instead, there was an extended period of indifference with less and less options speculation.
As a result the Smart Beta P/C was less effective the first half of 2015.
However, the DM/SM options indicator continued to perform well over the entire period. It's still too early to tell whether this time will see the melt up or distribution top, but the 2015 scenario fits better into my preference of 2020 being a high risk period.
Conclusions. Upside targets were reached with an early week fireworks display by the SPX, but may be followed by an after party hangover. I still have not given up on the 2015-type distribution top that could last thru the end of year. If so, investors are likely to view 2020 as a sure thing just like Nov-Dec 2018. After all, seasonality made late 2018 seem "safe", and the 2020 US elections are likely to be viewed the same.
The likely requirements for this scenario are a slowly improving economy with hope for rate cuts and hope for a China trade agreement keeping the SPX in a fairly tight range of 2850-3050.
Weekly Trade Alert. Extremely low bearish sentiment will likely start a 3-5% correction (SPX 2850-2900). Updates @mrktsignals.
Investment Diary, Indicator Primer, update 2019.04.27 Stock Buybacks, update 2018.03.28 Dumb Money/Smart Money Indicators
Article Index 2019 by Topic
Article Index 2018 by Topic
Article Index 2017 by Topic
Article Index 2016 by Topic
Long term forecasts
© 2019 SentimentSignals.blogspot.com
Subscribe to:
Comments (Atom)


