
Last week finally saw the 3-5% (act 3%) pullback expected into Fri optn exp and closed the week only slightly higher than predicted by the SPX options OI.
Next week could even be more interesting. With most expecting lower prices to complete an ABC decline from last Mon SPX 3550 the B wave top. However, an unusual combination of options indicators indicate otherwise. First, the Index P/C jumped to 2.0 (dumb money) Fri and the number of VIX puts rose to 500k+ (smart money) and the last time this divergence occurred was over a two day period Oct 8-9 with the SPX jumping 100+ pts the next few days. Next the SPX options OI is showing huge put positions Fri at 3430 and 3530 with posiive gamma likely pushing prices over 3530. Finally, another jump in OTM TLT puts indicates another jump in int rates is expected. Together, something positive is likely to happen next week. Will Amy Barrett's confirmation allow the Senate time to come up with a compromise on the next stimulus package?
With last weeks relative calm in the markets, I spent a few weeks working on the data mining software - adding some ETF indicators as well as a VIX BUY/SELL indicator which recently gave its 4th BUY in three years. See Tech/Other.
I. Sentiment Indicators
The overall Indicator Scoreboard (INT term, outlook two to four months) bearish sentiment actually fell last week even as the SPX saw a 3% pullback as we saw in late July in the first pullback after the rally off the June swoon.

The INT view of the Short Term Indicator (VXX $ volume and Smart Beta P/C [ETF Puts/Equity Calls], outlook two to four months) bearish sentiment has contined to decline and is now testing the lows seen in Jan and late Aug.

See Tech/Other for volatility update with VIX (volatlity) BUY signal.
Bonds (TNX). Bearish sentiment in bonds remains largely unchanged even as rates pulled back below 0.75%.

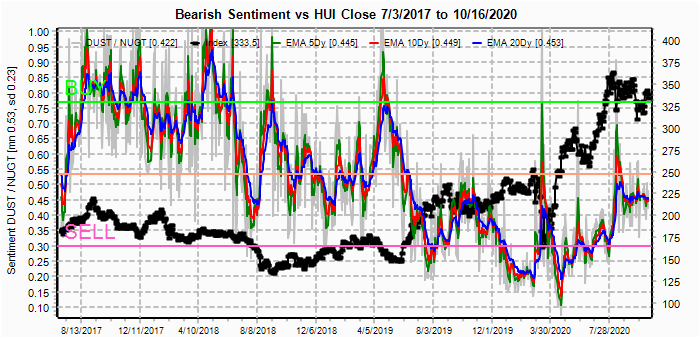
For the INT outlook with LT still negative, the gold miners (HUI) bearish sentiment remains unchanged.
II. Dumb Money/Smart Money Indicators
The option-based Dumb Money/Smart Money Indicator as short/INT term (outlook 2 to 4 mns/weeks) bearish sentiment has continued to fall and is now testing the lows seen at the Aug ATH..

And the sister options Hedge Ratio bearish sentiment has continued to fall and is now between the levels seen at the Jan and Aug ATHs.

The SPX and QQQ ETFs are discussed in Tech/Other using the data mining tools. .
III. Options Open Interest
Using Thur closing OI, remember that further out time frames are more likely to change over time, and that closing prices are more likely to be effected. Delta hedging may occur as reinforcement, negative when put support is broken or positive when call resistance is exceeded. This week I will look out thru Oct 23. Also, this week includes a look at the GDX for Nov exp.
With Fri close at SPX 3484, SPX showed the expected weakness and closed slightly above the range showed by Fri OI of 3430 to 3475.

SPX options OI for Mon show small put support extending up to 3450 with small call resistance at 3500. High P/C may contribute to a positive bias.

Wed has small OI where SPX stronger put support drops to 3400, but given recent history of very ST put additions, this will likely be stronger by Wed. Also, the unusually large put OI Fri may contribute to a positive bias.

For Fri, the huge put OI at 3430 and 3530 is almost the opposite of what was seen on Sept 30 where large call OI contributed to negative gamma (delta hedging) and the result is likely to be a catapult over 3530 by Fri with moderate call resistance starting at 3550.

For SPX EOM, there is moderate call resistance starting at 3500 with a low P/C and negative bias down toward 3450. Beginning to look a lot like the setup in Nov 2018 when the SPX went thru a month long flat wave before the Dec flush lower. Q3 GDP Oct 29 may provide a negative bias.

But with a wider view, the SPX EOM does show strong put support below 3250.

For the QQQ (NDX/41, 11k=268), closing at 288.5/NDX 11,852, there is strong put support about 2% lower and this may temper any pullback in the SPX..

Using the GDX as a gold miner proxy closing at 39.8, the 40-41 area has proven to be strong resistance and strong call resistance at 41 is likely to keep it so thru Nov exp. Also, low put support can be a problem if prices fall below 38.

Currently the TLT is 161.4 with the TNX at 0.74%, no chart this week but Fri 23rd TLT OI shows new posiion of 28k puts at 158.5 that may be the same smart money betting on higher rates again.
IV. Technical / Other
This week I took a few hours to add the SPX and QQQ ETFs to the data mining software as well as a VIX indicator using the SKEW and VIX term structure.
First, the SPX 2X ETFs (SDS & SSO) have performed better as BUYs than SELLs other than the Jan-Fen 2020 top. Current period most resembles that of Oct-Nov 2018, ie neutral.

Next the 3X (SPXU & UPRO, has been better at both BUYs and SELLs except Jan-Feb 2020 top and is now approaching a SELL. Not sure about the upward trend.

For the NDX, only the 3X (SQQQ/TQQQ) made sense. Mostly flat before late 2018, and now approaching a SELL.

Finally, looking at the VIX vs the 100/SKEW and VIX term structure. Both SKEW and VIX term structure track the VIX much more closely that the SPX which is probably why they do not generate good Buy/Sell signals for the SPX. However, for the VIX the composite (avg) of the StdVars has produced 4 BUY signals for the VIX at the -1.25 StdDev level over the last three years. The first three were followed by sharp spikes in the VIX with a 2-4 month lead time. The last signal was late Aug and with alternation may be a similar setup to Oct-Nov 2018.

Conclusions. As pointed last week, sentiment is pointing to an important near term top, but it is likely to be complex enough to catch most off guard. ST options sentiment is pointing to another rally next week that may reach or exceed Mon top at 3550. Looking back at Nov 2018, there were three rallies making up a flat where the first was the highest, so this time may alternate with the last being the highest forming a diagonal like form. If so next week may be the second based on some form oj agreement on a fiscal stimulus package, and then finally a third after the election. This would likely set up a failure of the Pres cycle with most expecting a continued rally into year end.
Weekly Trade Alert. Several options indicators are showing a setup for a rally by next Fri to at least reach the 3530 level and possibly as high as 3550-80. Updates @mrktsignals.
Investment Diary, Indicator Primer,
update 2020.02.07 Data Mining Indicators,
update 2019.04.27 Stock Buybacks,
update 2018.03.28 Dumb Money/Smart Money Indicators
No comments:
Post a Comment