Saturday, November 30, 2024

Wall Street is as Bullish as Late 2021, Is It Enough?

Last week was more positive than expected, although the outlook for a choppy market held thru Wed, the weaker US dollar and falling rates (TNX) helped the techs (NDX).  Trumpforia continued albeit at a slower pace gaining about 1% for the week vs 2% the previous week.  The appointment of Scott Bessent as Treasury Sec under Trump has helped calm inflation fears and lower LT rates.  Frothiness is starting to appear, however, as the NAAIM Index of active investment managers jumped to 98.9% from 90% the last two weeks, and readings of 100%+ have matched swing highs over the last two years.

Much of Wall Street has bought into the new era of Trumponomics as evidenced by the recent outlook by UBS for SPX 6600 in 2025, while one of WS biggest bears, BofAs M. Harnett (remember "Sell the 1st rate cut"), is even looking for SPX 6666.  WS outlook is much like late 2021 with the unanimous bullishness, but bearish sentiment remains "sticky" as measured here, so an immediate downturn is likely to be delayed.  Currently, the sentiment measure with the most bearish outlook ST is the VIX call indicator at a weak Sell after a strong Buy pre-election.


I. Sentiment Indicators

The INT/LT Composite indicator (outlook 3 to 6+ months) has three separate components. Starting Aug 26, 2023 SPX options are removed due to extreme 0DTE volume distortions. New weights are ETF put-call indicator (30%), SPX 2X ETF INT ratio (40%), and 3rd a volatility indicator (30%) which combines the options volatility spread of the ST SPX (VIX) to the ST VIX (VVIX) with the UVXY $ volume.

Update Alt, INT view. Bearish sentiment remains near the weak Sell due to weak hedging.

Update Alt EMA. Bearish sentiment VST (grn) fell to a strong Sell, indicating lower prices/higher volatility for the coming week. The ST Composite as a ST (1-4 week) indicator includes the NYSE volume ratio indicator (NYDNV/NYUPV & NYDNV/NYDEC) and the UVXY $ Vol/[SPX Trend, SMA only]. Weights are 80%/20%.

Update. Bearish sentiment remains near neutral.

Update EMA. Bearish sentiment reversed sharply from a weqk Sell to above neutral by the EOW.  Any downside likely limited.
The ST VIX calls and SPXADP indicator bearish sentiment fell sharply from neutral to a weak Sell.  High put volume gave a strong pre-election Buy but has now reversed to cause a weak Sell.  A pickup in volatility is likely by EOW.
The ST/INT Composite indicator (outlook 1 to 3 months) is based on the Hedge Spread (48%) and includes ST Composite (12%) and three options FOMO indicators using SPX (12%), ETF (12%), and Equity (12%) calls compared to the NY ADV/DEC issues (inverted). FOMO is shown when strong call volume is combined with strong NY ADV/DEC. See Investment Diary addition for full discussion.

Update EMA. Bearish sentiment remains near a strong Sell.

Bonds (TNX)Bearish sentiment remains near low extremes as rates fell when inflation fears over Trump policies fell after Bessett was announced as newTreasury Sec. For the INT outlook, the gold miners (HUI) bearish sentiment is presented in a new format using the data mining software to add the inverse TNX rate to the ETF ratio.

Update. Bearish sentiment remains near a strong Sell on weak DUST volume.


II. Dumb Money/Smart Money Indicators

This is a new hybrid option/ETF Dumb Money/Smart Money Indicator as a INT/LT term (outlook 2-6 mns) bearish sentiment indicator. The use of ETFs increases the duration (term).

Update. Bearish sentiment fell sharply to near a strong Sell (VST) but as in late 2021 can be several months early.

With the sister options Hedge Spread as a ST/INT indicator (outlook 1-3 mns), bearish sentiment also fell to a strong Sell (VST) while the INT/LT (blu) still has a way to go to match late 2021. A new composite SPX options indicator uses both the volume adj (1/B-A) and P/C equivalent spread (A-B) to compensate for the discrepancy between the two.  This replaces the old SPX options indicator for the SPX ETFs + options below and the INT/LT composite. No chart.

For the SPX, I am switching to hybrid 2X ETFs plus SPX options. Taking a look at the INT term composite (outlook 2 to 4 mns), bearish sentiment pulled back to neutral.

For the NDX combining the hybrid ETF options plus NDX 3X ETF sentiment with the interest rate effect,  (outlook 2 to 4 mns) bearish sentiment shows similar extremes between ETF and options as in late 2020 which resulted in a choppy market until options sentiment rose.  Note QQQ options are optimal, but are N/A and are included in ETF options.

Bearish sentiment remains near a strong Sell.

For the SPX combining the hybrid ETF options plus SPX 2X ETF (outlook 2 to 4 mns) produces an indicator where, in this case, ETF options are a proxy for the SPY options.

Bearish sentiment for SPX remains below a weak Sell.


III. Options Open Interest

Using Thur closing OI, remember that further out time frames are more likely to change over time, and that closing prices are more likely to be effected. Delta hedging may occur as reinforcement, negative when put support is broken or positive when call resistance is exceeded.  This week I will look out thru Dec 6. A text overlay is used for extreme OI to improve readability, P/C is not changed.  A new addition is added for OI $ amounts with breakeven pts (BE) where call & put $ amounts cross.

With Fri close at SPX 6032, options OI for Mon is moderate with resistance from ITM calls, and stronger resistance at 6090-6100.  No strong bias.
Wed has smaller OI where SPX has stronger call resistance at 6000 and 6075.  If 6075 holds, expect a move toward 6000.
For Fri SPX has moderate OI and strong ITM call resistance and OTM above 6050.  Should see a move toward 6000.

IV. Technical / Other

The following uses barcharts.com as a source and discusses S&P futures (ES) as a third venue of stock sentiment in addition to options and ETFs.  The non-commercial/commercial spread represents a LT bearish sentiment (dumb money/smart money) indicator. As explained in investopedia, commercial investors (red) are institutions and are smart money, while non-commercials (green) are speculators such as hedge funds and are dumb money. Here is the current  barchart graph for the S&P 500 (top) and trader positions (1st bot) with positives as net longs and negatives as net shorts.  Bearish sentiment is represented by the spread and is positive if red > green (Buy) and negative if green > red (Sell).   ES (SPX) sentiment remains at a weak Sell at -0.75 SD, NQ (NDX) is near a strong Sell at -1.75 SD, YM (DJIA) remains a weak Sell -1.0 SD.

Click dropdown list to select from the following options:

Tech / Other History
2024

2023

2022

Other Indicators

Conclusions.   Many had been calling to an end to the current bull market for much of the year based on valuations, parabolic moves in AI related tech stocks, and even a 2008-09 financial crisis brought on by CRE-related banking problems, but as a result bearish sentiment remains resilient enough to support higher prices.  At some point things will change, but it is hard to tell when, at this point an 8-10% correction may occur in 2025 Q1, but the result would ikely be higher prices later.

Weekly Trade Alert.  Given the ST indicators, a pullback to SPX 6000 could occur by EOW, or more highs would likely lead to a bigger decline mid-Dec, possibly due to FOMC disappointment.  Updates @mrktsignals.

Investment DiaryIndicator Primer, Tech/Other Refs,
 update 2021.07.xx  Data Mining Indicators - Update, Summer 2021,
 update 2020.02.07 Data Mining Indicators,
 update 2019.04.27 Stock Buybacks,
 update 2018.03.28 Dumb Money/Smart Money Indicators

Article Index 2019 by Topic, completed thru EOY 2020.02.04
Article Index 2018 by Topic
Article Index 2017 by Topic
Article Index 2016 by Topic

Long term forecasts

© 2024 SentimentSignals.blogspot.com

Saturday, November 23, 2024

Preparing for Turkey Day

A weak bounce for the week was expected over SPX 5900 before a retest of the lows (5853) by EOM from the previous weeks close at 5869.  The SPX started out stronger than expected with a Mon move over 5900 followed retests of the lows both Tue & Wed open with news of an exchange of more advanced missiles by Ukraine and Russia.  The result was an increase in bearish sentiment that resulted in even higher prices, pushing the SPX to a high of 5973 by Fri.  Undoubtedly, sentiment was supported by a major change in common EW outlook as shown by Avi as the prior drop to 5853 caused an overlap of w-1 and w-4 which invalidated Avi's outlook for a direct move to SPX 6100-200.  Instead, his primary count became a bear market with SPX 3800 expected by mid-2025, and the alt-bullish count was for a drop to SPX 5600s by early Dec then a move to 6200+ early 2025.  However, last weeks performance is more consistent with Tom Demark's outlook as the DJIA continued to plow ahead aided by foreign investors preference for US stocks as the US$ advances, while SPX and NDX lagged.

Only minor changes were seen for sentiment during the week as ST sentiment moved from positive to neutral.  SPX options OI reflects the increased bearish sentiment from last weeks early gyrations and is now showing put support around 5900.  Hedging remains very low and intra-day volatility is expected to continue.


I. Sentiment Indicators

The INT/LT Composite indicator (outlook 3 to 6+ months) has three separate components. Starting Aug 26, 2023 SPX options are removed due to extreme 0DTE volume distortions. New weights are ETF put-call indicator (30%), SPX 2X ETF INT ratio (40%), and 3rd a volatility indicator (30%) which combines the options volatility spread of the ST SPX (VIX) to the ST VIX (VVIX) with the UVXY $ volume.

Update Alt, INT view. Bearish sentiment fell to a weak Sell as ETF P/Cs (hedging) fell sharply.

Update Alt EMA. Bearish sentiment VST (grn) rose above a weak Sell at the EOW. The ST Composite as a ST (1-4 week) indicator includes the NYSE volume ratio indicator (NYDNV/NYUPV & NYDNV/NYDEC) and the UVXY $ Vol/[SPX Trend, SMA only]. Weights are 80%/20%.

Update. Bearish sentiment fell below neutral.

Update EMA. Bearish sentiment fell sharply from above neutral to nearing a weak Sell.
The ST VIX calls and SPXADP indicator bearish sentiment fell from slightly positive to neutral.
The ST/INT Composite indicator (outlook 1 to 3 months) is based on the Hedge Spread (48%) and includes ST Composite (12%) and three options FOMO indicators using SPX (12%), ETF (12%), and Equity (12%) calls compared to the NY ADV/DEC issues (inverted). FOMO is shown when strong call volume is combined with strong NY ADV/DEC. See Investment Diary addition for full discussion.

Update EMA. Bearish sentiment fell to a strong Sell VST (grn) and is in the area where several ST pullbacks occurred, mainly due to low hedging.

Bonds (TNX)Bearish sentiment remains at low extremes as rates consolidate below 4.5%. For the INT outlook, the gold miners (HUI) bearish sentiment is presented in a new format using the data mining software to add the inverse TNX rate to the ETF ratio.

Update. Bearish sentiment continued to fall beyond a weak Sell as DUST volume remains very low.


II. Dumb Money/Smart Money Indicators

This is a new hybrid option/ETF Dumb Money/Smart Money Indicator as a INT/LT term (outlook 2-6 mns) bearish sentiment indicator. The use of ETFs increases the duration (term).

Update. Bearish sentiment rose slightly but remains near a weak Sell.

With the sister options Hedge Spread as a ST/INT indicator (outlook 1-3 mns), bearish sentiment continues to edge lower. A new composite SPX options indicator uses both the volume adj (1/B-A) and P/C equivalent spread (A-B) to compensate for the discrepancy between the two.  This replaces the old SPX options indicator for the SPX ETFs + options below and the INT/LT composite. No chart.

For the SPX, I am switching to hybrid 2X ETFs plus SPX options. Taking a look at the INT term composite (outlook 2 to 4 mns), bearish sentiment remains positive.

For the NDX combining the hybrid ETF options plus NDX 3X ETF sentiment with the interest rate effect,  (outlook 2 to 4 mns) bearish sentiment shows similar extremes between ETF and options as in late 2020 which resulted in a choppy market until options sentiment rose.  Note QQQ options are optimal, but are N/A and are included in ETF options.

Bearish sentiment declined to just above a strong Sell.

For the SPX combining the hybrid ETF options plus SPX 2X ETF (outlook 2 to 4 mns) produces an indicator where, in this case, ETF options are a proxy for the SPY options.

Bearish sentiment for SPX declined to a weak Sell.


III. Options Open Interest

Using Thur closing OI, remember that further out time frames are more likely to change over time, and that closing prices are more likely to be effected. Delta hedging may occur as reinforcement, negative when put support is broken or positive when call resistance is exceeded.  This week I will look out thru Nov 29. A text overlay is used for extreme OI to improve readability, P/C is not changed.  A new addition is added for OI $ amounts with breakeven pts (BE) where call & put $ amounts cross.

With Fri close at SPX 5969, options OI for Mon is moderate with some put support in the low 5900s and call resistance at 5990.
Wed has small OI where SPX has strong put support at 5900 and call resistance over 5970.
For Fri EOM strong SPX OI shows negative bias toward 5900, but delta hedging could keep prices between 5940 and 5990, strong resistance.

IV. Technical / Other

The following uses barcharts.com as a source and discusses S&P futures (ES) as a third venue of stock sentiment in addition to options and ETFs.  The non-commercial/commercial spread represents a LT bearish sentiment (dumb money/smart money) indicator. As explained in investopedia, commercial investors (red) are institutions and are smart money, while non-commercials (green) are speculators such as hedge funds and are dumb money. Here is the current  barchart graph for the S&P 500 (top) and trader positions (1st bot) with positives as net longs and negatives as net shorts.  Bearish sentiment is represented by the spread and is positive if red > green (Buy) and negative if green > red (Sell).  ES (SPX) sentiment remains at a weak Sell at -0.85 SD, NQ (NDX) is at stronger weak Sell at -1.5 SD, YM (DJIA) remains a weak Sell -1.0 SD.

Click dropdown list to select from the following options:

Tech / Other History
2024

2023

2022

Other Indicators

Conclusions.   Despite insanely high stock prices by many measures the current bull market keeps going up much like the Energizer bunny.  One potential reason for this as mentioned in several excerpts above is the speculation by longs and shorts as shown by the ETF Puts & Calls.

As you can see from above, speculation is much higher based on volume of P&Cs compared to late 2021 and is more like mid-2023 following a large correction with high bearish sentiment when P volume > Cs, indicating strong hedging, but as we are currently seeing C volume > P, so hedging is low and risk is rising.  However, P volume is still much higher than late 2021, so risk is lower. 

Weekly Trade Alert.  Next week could see a pullback toward SPX 5900 based on SPX options OI support, but ST indicators remain neutral, so sideways chop is also possible thru EOM.  Updates @mrktsignals.

Investment DiaryIndicator Primer, Tech/Other Refs,
 update 2021.07.xx  Data Mining Indicators - Update, Summer 2021,
 update 2020.02.07 Data Mining Indicators,
 update 2019.04.27 Stock Buybacks,
 update 2018.03.28 Dumb Money/Smart Money Indicators

Article Index 2019 by Topic, completed thru EOY 2020.02.04
Article Index 2018 by Topic
Article Index 2017 by Topic
Article Index 2016 by Topic

Long term forecasts

© 2024 SentimentSignals.blogspot.com

Saturday, November 16, 2024

Not Likely the Final Top

Last weeks outlook was about as good as possible without a crystal ball.  The SPX was expected to hang around 6K for couple days then decline to 5900-50 into the Fri AM optn exp with lower prices in the PM if the drop occurred.  In fact, the SPX flirted with 6K thru mid-day Wed before turning down with late day selloffs as predicted by the futures (COT) with a Thur close at 5950.  Fri began with a gap down to 5913 and continued to slide to a PM low at 5853 before a late recovery.  Surprisingly, the decline of over 2.5% did little to improve sentiment which in some cases became more bearish (hedge spread, NQ futures).

Next week is expected to see a weak bounce based on SPX options Oi, but the ST indicators (ST composite and VIX calls remain neutral) and a move back below 5900 is expected by the EOM.  There was an interesting article by Tom DeMark on MW Fri where he sees similarities to 1929, but still expects the DJIA to reach the 47K level and SPX 6150, possibly near the inauguration late Jan 2025.  Current price action in the techs relative to the DJIA remains reminiscent to 2000 where the DJIA remained between 10k to 11k all year while weakness pervaded the techs.


I. Sentiment Indicators

The INT/LT Composite indicator (outlook 3 to 6+ months) has three separate components. Starting Aug 26, 2023 SPX options are removed due to extreme 0DTE volume distortions. New weights are ETF put-call indicator (30%), SPX 2X ETF INT ratio (40%), and 3rd a volatility indicator (30%) which combines the options volatility spread of the ST SPX (VIX) to the ST VIX (VVIX) with the UVXY $ volume.

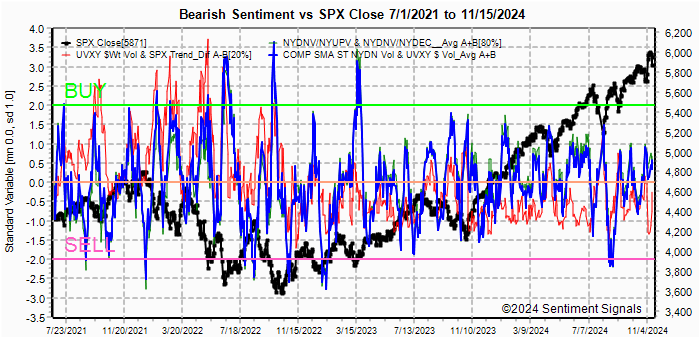
Update Alt, INT view. Bearish sentiment declined slightly to near a weak Sell.

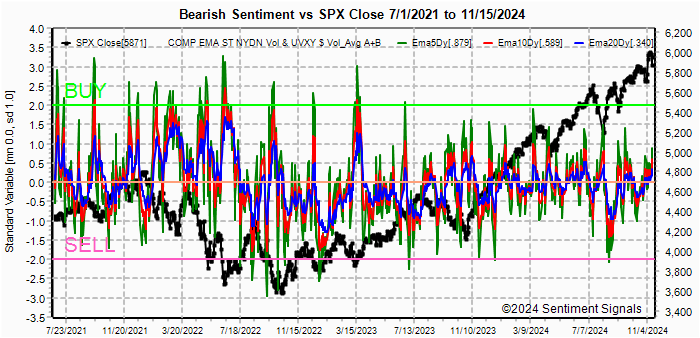
Update Alt EMA. Bearish sentiment declined slightly to near a weak Sell. The ST Composite as a ST (1-4 week) indicator includes the NYSE volume ratio indicator (NYDNV/NYUPV & NYDNV/NYDEC) and the UVXY $ Vol/[SPX Trend, SMA only]. Weights are 80%/20%.

Update. Bearish sentiment  is essentially unchanged.

Update EMA. Bearish sentiment is essentially unchanged. The ST VIX calls and SPXADP indicator bearish sentiment is little changed.
The ST/INT Composite indicator (outlook 1 to 3 months) is based on the Hedge Spread (48%) and includes ST Composite (12%) and three options FOMO indicators using SPX (12%), ETF (12%), and Equity (12%) calls compared to the NY ADV/DEC issues (inverted). FOMO is shown when strong call volume is combined with strong NY ADV/DEC. See Investment Diary addition for full discussion.

Update EMA. Bearish sentiment remains at a weak Sell due to the low Hedge Spread.

Bonds (TNX)Bearish sentiment remains at low extremes, but improved slightly as rates approach the 4.5% level. For the INT outlook, the gold miners (HUI) bearish sentiment is presented in a new format using the data mining software to add the inverse TNX rate to the ETF ratio.

Update. Bearish sentiment continued to dive with low DUST volume, even as gold stocks approach the bear market mark of down 20%.


II. Dumb Money/Smart Money Indicators

This is a new hybrid option/ETF Dumb Money/Smart Money Indicator as a INT/LT term (outlook 2-6 mns) bearish sentiment indicator. The use of ETFs increases the duration (term).

Update. Bearish sentiment declined slightly, reaching the weak Sell level.

With the sister options Hedge Spread as a ST/INT indicator (outlook 1-3 mns), bearish sentiment reversed sharply with the post-election rally, now approaching a strong Sell. A new composite SPX options indicator uses both the volume adj (1/B-A) and P/C equivalent spread (A-B) to compensate for the discrepancy between the two.  This replaces the old SPX options indicator for the SPX ETFs + options below and the INT/LT composite.

For the SPX, I am switching to hybrid 2X ETFs plus SPX options. Taking a look at the INT term composite (outlook 2 to 4 mns), bearish sentiment remains slightly positive.

For the NDX combining the hybrid ETF options plus NDX 3X ETF sentiment with the interest rate effect,  (outlook 2 to 4 mns) bearish sentiment shows similar extremes between ETF and options as in late 2020 which resulted in a choppy market until options sentiment rose.  Note QQQ options are optimal, but are N/A and are included in ETF options.

Bearish sentiment was understated in last week';s update as I missed the reverse 5-1 SQQQ split on Thur and only got to a weak Sell before declining with last weeks decline (BTFD effect still too strong).

For the SPX combining the hybrid ETF options plus SPX 2X ETF (outlook 2 to 4 mns) produces an indicator where, in this case, ETF options are a proxy for the SPY options.

Bearish sentiment for SPX declined to a weak Sell with low ETF P/Cs.


III. Options Open Interest

Using Thur closing OI, remember that further out time frames are more likely to change over time, and that closing prices are more likely to be effected. Delta hedging may occur as reinforcement, negative when put support is broken or positive when call resistance is exceeded.  This week I will look out thru Nov 22. A text overlay is used for extreme OI to improve readability, P/C is not changed. Also, this week includes a look at the TLT & GDX for Dec exp.   A new addition is added for OI $ amounts with breakeven pts (BE) where call & put $ amounts cross.

With Fri close at SPX 5871, options OI for Mon is moderate with a strong bearish bias over 5900. Target is 5900-50.
Wed has somewhat smaller SPX OI where SPX has stronger put support at lower levels and should maintain 5900+ if reached.
For Fri SPX gas moderate OI with a large straddle that may have a positive bias.
For Fri Nov 29 EOM strong SPX OI with a strong bullish bias that should push prices back below 5900 toward 5850.
Using the GDX as a gold miner proxy closing at 35.5 has declined to strong put support, but as this contradicts the HUI ETF sentiment, lower prices are possible.

Currently the TLT is 90.1 with the TNX at 4.43%, TLT has declined to strong put support that may support prices and keep TNX from rising over 4.5%.


IV. Technical / Other

The following uses barcharts.com as a source and discusses S&P futures (ES) as a third venue of stock sentiment in addition to options and ETFs.  The non-commercial/commercial spread represents a LT bearish sentiment (dumb money/smart money) indicator. As explained in investopedia, commercial investors (red) are institutions and are smart money, while non-commercials (green) are speculators such as hedge funds and are dumb money. Here is the current  barchart graph for the S&P 500 (top) and trader positions (1st bot) with positives as net longs and negatives as net shorts.  Bearish sentiment is represented by the spread and is positive if red > green (Buy) and negative if green > red (Sell).  ES (SPX) sentiment is at a weak Sell at -0.85 SD, NQ (NDX) is at weak Sell at -1.25 SD, YM (DJIA) remains a weak Sell -1.25 SD.

Click dropdown list to select from the following options:
Tech / Other History
2024

2023

2022

Other Indicators

Conclusions.  Weakness in the monthly options exp undoubtedly surprised many of the bulls, but seemed to do little to change sentiment as signs of FOMO continued in indicators such as the hedge spread (ETF P/Cs) and NDX futures.  Typically, the high volume at options exp is a sign of accumulation/distribution with Fri at 150% of avg and leads to a reversal, but the EOM options Oi is much like Fri so a retest of the lows is expected by EOM.

Weekly Trade Alert.  A move to SPX 5900-50 is expected next week, but is not expected to be a change in trend (b-wave).  Updates @mrktsignals.

Investment DiaryIndicator Primer, Tech/Other Refs,
 update 2021.07.xx  Data Mining Indicators - Update, Summer 2021,
 update 2020.02.07 Data Mining Indicators,
 update 2019.04.27 Stock Buybacks,
 update 2018.03.28 Dumb Money/Smart Money Indicators

Article Index 2019 by Topic, completed thru EOY 2020.02.04
Article Index 2018 by Topic
Article Index 2017 by Topic
Article Index 2016 by Topic

Long term forecasts

© 2024 SentimentSignals.blogspot.com