Saturday, May 23, 2020

A Short Term Volatility Spike is Possible

Last week appeared to be the b-wave high that I had been looking for two weeks ago in the range of SPX 2950-75 with last week's high at 2980.   Sentiment is now indicating a continuation of the vacillations with the potential for a drop of 200+ points in the SPX over the next two to three weeks.  The likely cause will be increased tension with China over next weeks vote on their "national security law" which would be aimed at Hong Kong's dissidents bypassing the HK legal system.

On the virus front, last news out Friday indicated that Trump's favorite treatment HCQ was of no benefit treating CV and increased mortality due to heart problems in a world-wide study of 69k patients, while the Wall Street favorite Remdesivir was shown to have no statistical benefit in a published research article.


I. Sentiment Indicators

The overall Indicator Scoreboard (INT term, outlook two to four months) bearish sentiment continues to decline in a stair step fashion, indicating a ST pullback is likely.
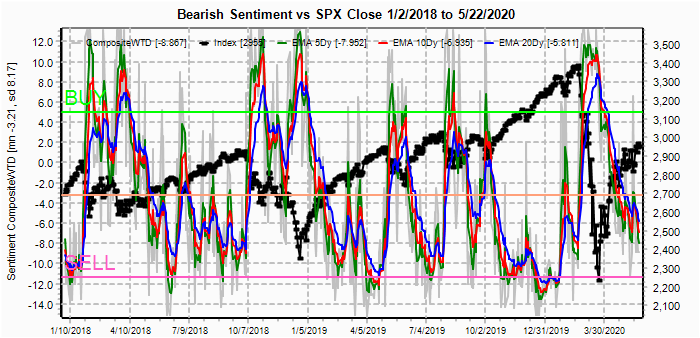

The INT view of the Short Term Indicator (VXX $ volume and Smart Beta P/C [ETF Puts/Equity Calls], outlook two to four months) bearish sentiment continues to decline sharply, indicating that a short, but sharp, decline is possible.  Sentiment is similar to May 2019 where a drop was seen from SPX 2945 to 2729.


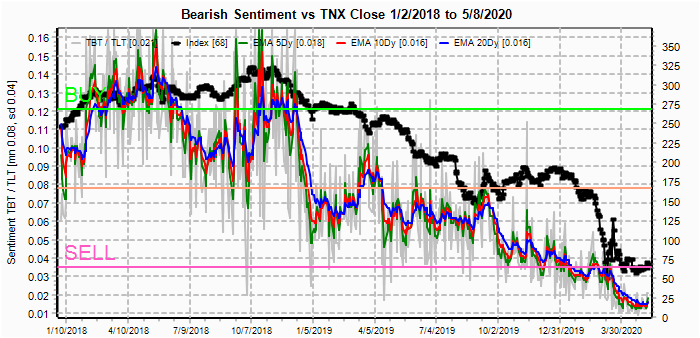
Bonds (TNX).  Interest rates remain mostly unchanged as is sentiment.


For the INT outlook with LT still negative, the gold miners (HUI) bearish sentiment is somewhat less extreme with the small pullback to GDX 280.


II. Dumb Money/Smart Money Indicators

The option-based Dumb Money/Smart Money Indicator as short/INT term (outlook 2 to 4 mns/weeks) bearish sentiment comparable to the Jan and Dec 2018 tops as well as Jan 2020.  This could mean a sharp but short decline is likely, but the Overall Composite indicates it will likely be a buying oppty.


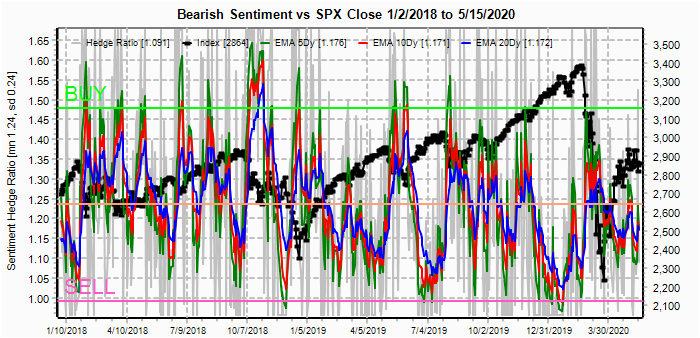
And the sister options Hedge Ratio bearish sentiment is lagging, so only a moderate increase in volatility is expected, but sentiment is comparable to May 2019 which saw a 200+ pt drop in the SPX.


III. Options Open Interest

Using Thur closing OI, remember that further out time frames are more likely to change over time, and that closing prices are more likely to be effected. Delta hedging may occur as negative reinforcement when put support is broken or call resistance is exceeded. This week I will look out thru May 29. Also, This week includes a look at the TLT for Jun exp.

With Fri close at SPX 2955, options OI for Tue (date is 26th not 25th) show little bias between put support at 2875 and 2975.  Likely range is SPX 2945-65.


Wed has similar OI size where SPX OI resembles a mirror image of last Mon which saw little call resistance until 2950 and resulted in a 100 pt rally.  Now, there is a negative bias down to 2900 and little put support until 2800, so the almost certain China passage of the "national security law" aimed at HK may cause a sharp decline toward the 2800 level.


For Fri, large OI shows strong resistance over SPX 2850, but large positions at 2800, 2850 and 2900 are offset as straddles, and relevant support seems to be the puts at 2825 and call resistance at 2880.


For next Fri (jobs report), overlapping OI indicates a wide possible range between SPX 2800 and 2950 that will likely change depending on next weeks action.


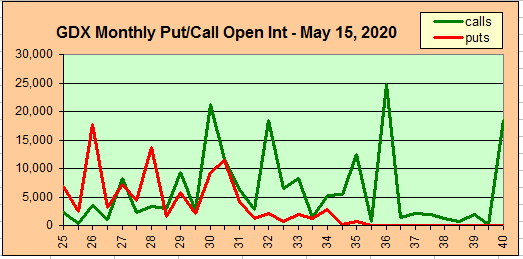
Using the GDX as a gold miner proxy closing at 35.5, remains in positive delta hedging.

Currently the TLT is 165.5 with the TNX at 0.66%, there is a slight negative bias with put support at 160 and call resistance at 165. 


IV. Technical / Other

Two of the most informative indicators from the data mining software have been the SPX hedge spread (SPX puts - ETF calls) and the Crash Indicator.  The SPX hedge spread is mildly negative, indicating that a major top is not expected, while the Crash Indicator is essentially neutral.


The conclusion is that a decline is expected similar to May 2019 that may last 1 to 3 weeks and possibly range between the 100 SMA at 2970 and 50 SMA at 2730.


Conclusions.  A temporary downturn should begin next week that will likely be attributed to increasing tensions between the US and China as China seems to be ready to move ahead with a crackdown on dissidents in Hong Kong under the guise of a national security law (not unlike the US DHS being given free reign to prosecute anyone labelled a terrorist).  If similar to May 2019, the decline will likely be an ABC with the first target around SPX 2800 which options OI indicate could happen next week.

Weekly Trade Alert.  An early week bounce to SPX 2965-75 would be a good target for a ST short targeting SPX 2800-20.  Updates @mrktsignals.

Investment Diary,  Indicator Primer,
 update 2020.02.07 Data Mining Indicators,
 update 2019.04.27 Stock Buybacks,
 update 2018.03.28 Dumb Money/Smart Money Indicators

Article Index 2019 by Topic, completed thru EOY 2020.02.04
Article Index 2018 by Topic
Article Index 2017 by Topic
Article Index 2016 by Topic

Long term forecasts

© 2020 SentimentSignals.blogspot.com

Saturday, May 16, 2020

Pullback in Progress

Last week I was looking for a test of the SPX 2950-75 area before starting a 10% pullback and Mon started strong, making it to 2945, but Powell's reticence to consider negative interest rates and Trump's threat to pursue trade war retaliations against China quickly sent the market into a tailspin, dropping to a Thur AM low at 2766.  The combination of the "re-open America" and the trade war targeting technology may also have started a rotation out of the FAAMG stocks into small caps and cyclicals.

Sentiment is unclear at the moment as to whether further downside is imminent or more rally is likely.  Currently, options Oi indicates at least a retest of the SPX 2750 area by EOM.


I. Sentiment Indicators

The overall Indicator Scoreboard (INT term, outlook two to four months) bearish sentiment has gone from a very weak SELL a week ago to neutral that may mean some strength ahead before further weakness, while a continued decline would generate a weak BUY.


The INT view of the Short Term Indicator (VXX $ volume and Smart Beta P/C [ETF Puts/Equity Calls], outlook two to four months) bearish sentiment remains well below neutral indicating that continued volatility should be expected.


Bonds (TNX).  Bond sentiment remains at extreme lows, while some, including GS, are warning that the $3T bailout package could pressure interest rates when bonds are sold to finance the bailout if the Fed does not go full MMT to monetize the debt.


For the INT outlook with LT still negative, the gold miners (HUI) bearish sentiment remains near extreme lows as record bailout has convinced gold bugs that hyper-inflation is on the way..


II. Dumb Money/Smart Money Indicators

The option-based Dumb Money/Smart Money Indicator as short/INT term (outlook 2 to 4 mns/weeks) remains near recent lows indicating the recent rally has likely run out of steam.


And the sister options Hedge Ratio sentiment has moved toward neutral, and that may be enough to cause a pause in the current downtrend.


III. Options Open Interest

Using Thur closing OI, remember that further out time frames are more likely to change over time, and that closing prices are more likely to be effected. Delta hedging may occur as negative reinforcement when put support is broken or call resistance is exceeded. This week I will look out thru May 29. Also, This week includes a look at the GDX for Jun exp.

With Fri close at SPX 2864, options OI for Mon shows modest put support at SPX 2750 and call resistance at 2960 with little in between.  The small call resistance starting at 2850 may mean a negative start to the week.


Wed has somewhat larger OI where SPX put support moves up to 2850 with minimal call resistance up to 2900 and may result in a continuation of the rally off of last weeks lows.


For Fri, large OI may influence weekly behavior and shows strong put support at SPX 2825 and below and the key is what happens at 2875.  If early weakness during the week increases put support, a move over 2875 has only small call resistance up to 2940 then 2975.


For May 29 EOM, other than the large straddles at SPX 2800, 2850 and 2900 there is little put support until 2750 with small call resistance at 2875 and over 2900.  A wide range of prices is possible, although OI is likely to change over the next week or two.


Using the GDX as a gold miner proxy closing at 36.57, Fri jump over the strong call resistance at 35 has opened up the potential of positive dynamic hedging pushing price toward 40, but dynamic hedging can also result in strong whipsaws by exp. 


Currently the TLT is 166.7 with the TNX at 0.64% and the strong call resistance at 170 has held. 


IV. Technical / Other

One of the reason I have a hard time being too bearish at the moment is the Crash Indicator that remains modestly positive.  Although not as strong or as timely as I would have liked, the Jan SELL did finally prove prescient and a decline to -1.0 is likely before a larger decline.


Also, reviewing some of my archived charts, I ran across a Bradly Turn Chart from 2014 (the last year they were published), and surprisingly It seems to fit well for what sentiment seems to be saying to expect for 2020.


Conclusions.  Recent progress in the antibody approach to treating Covid-19 seems to be very promising, although largely ignored by the markets.  The biggest hurdle to returning the US economy to normal after a near complete shutdown is that the cost and time to do so are likely to be greater than any one expects, and Trumps "everything is great" speech at the SOTU is not going to go very well at the Nov election.  Now Trump seems to be using China as the bogeyman to deflect blame from himself, but can also prove longer term problematic for the markets.  Particularly, using the near monopoly of advanced computer chips by the US and Taiwan, the threat of cutting off sale of chips to China may force China to use a more aggressive approach to integrate Taiwan with the mainland.

Weekly Trade Alert.  Lower prices to SPX 2750 are likely by EOM, but it is difficult to tell if more rally is likely first.  Breakdown from the bear flag shown last week could see  a retest of the lower TL near 2940 Fri before lower prices.  Updates @mrktsignals.


Investment Diary,  Indicator Primer,
 update 2020.02.07 Data Mining Indicators,
 update 2019.04.27 Stock Buybacks,
 update 2018.03.28 Dumb Money/Smart Money Indicators

Article Index 2019 by Topic, completed thru EOY 2020.02.04
Article Index 2018 by Topic
Article Index 2017 by Topic
Article Index 2016 by Topic

Long term forecasts

© 2020 SentimentSignals.blogspot.com

Saturday, May 9, 2020

Are Negative Rates on the Horizon?

Last weeks outlook went much as expected thru Wed with Mon drop to SPX to the 2800 support level followed by a strong bounce and fade. The bounce was stronger than expected reaching 2898 Tue and the fade thru O/N Wed hit the low target of 2820-40, but Thur bond futures began predicting negative rates by EOY 2020 that caused a surge in stocks and gold with the SPX continuing higher thru Fri even as bond futures reversed.  Apparently stock investors were expecting both a V-economic recovery and negative rates.  Unless there is no recovery, negative rates are highly unlikely and stocks are likely to see a repeat of Mar decline without a strong recovery.

The SPX does seem to be approaching a more important top with next week expected to reach the target of 2950-75 with a double top for the ES at 2970-80.  The last decline was 5% and this time I expect a full 10% to 2600-50, possibly followed by another b-wave higher.  Timing-wise, Raj at Times&Cycles is projecting a flash crash cycle for late May and M.Armstrong has a panic cycle scheduled for the week of May 25th.

Many are expecting SPX 2450, but a series of b-waves are possible with higher highs and lower lows to confuse and frustrate the bears.  Currently the futures are following a bear flag that points to SPX 2600-50 upon breakdown.


There is also a setup for negative RSI divergence.


I. Sentiment Indicators

The overall Indicator Scoreboard (INT term, outlook two to four months) bearish sentiment has dropped much lower than Mar & Nov of 2018 before retest or lower lows and is a sign of strength.  Higher highs are likely in the months ahead, but larger problems are likely in the Fall.


The INT view of the Short Term Indicator (VXX $ volume and Smart Beta P/C [ETF Puts/Equity Calls], outlook two to four months) bearish sentiment has fallen very sharply and may generate a SELL in the next week or two.


Bonds (TNX).  Interest rates may have bottomed in the 0.50-0.75% range.  As discussed by Nomura's C.McElligott, this may be a sign of bear steepening as supply due to the expanding deficit outstrips demand.


For the INT outlook with LT still negative, the gold miners (HUI) bearish sentiment remains extremely low as easy money fuels the demand for safe havens.


II. Dumb Money/Smart Money Indicators

The option-based Dumb Money/Smart Money Indicator as short/INT term (outlook 2 to 4 mns/weeks) is warning of extreme complacency by options speculators similar to early 2020.


And the sister options Hedge Ratio sentiment is finally showing the sharper reduction in hedging that precedes most significant declines.


III. Options Open Interest

Using Thur closing OI, remember that further out time frames are more likely to change over time, and that closing prices are more likely to be effected. Delta hedging may occur as negative reinforcement when put support is broken or call resistance is exceeded.  This week I will look out thru May 15. Also, This week includes a look at the TLT for May exp.

With Fri close at SPX 2930, options OI for Mon is somewhat light, but the SPX has risen over put support and the 2920-40 area is the likely range.


Wed has very small OI where SPX has some put support up to 2910 and very little call resistance up to 2980.  With Fed chair Powell scheduled to speak this may be an opportunity to spike up to the 2950-75 area.


For Fri, moderate OI is composed mostly of straddles.  The largest straddle is at SPX 2950 and may be a point of attraction if there is no news event, otherwise volatility could reign as calls provide a negative bias down to 2800.


Currently the TLT is 164 with the TNX at 0.68%.  Two weeks ago with the TLT near 170, I pointed out the strong call resistance and a lack of put support and prices have fallen about 3% since then.  The announcement that the Treasury will be financing "the covid related bailouts" by issuing 20 yr bonds will likely continue to pressure LT bonds.


IV. Technical / Other

One of the LT indicators that continues to worry me is the daily NYSE McClellan Summation Index.  Comparing the current reading of 160 to other rallies off of bear market bottoms as some are claiming this is, such as Mar 2009, Feb 2016 and Dec 2018, the Summ Index reached +1000 quickly, while this rally looks more like 2008.  This may be due to concentration in FAAMG leadership as "work at home" places increased dependence on tech, but raises questions as to the strength of the economy.


Conclusions.  The unusually strong response by the Fed to support the markets coupled with large stimulus from Congress has resulted in a very strong bounce in the markets, but I continue to feel that markets are not as healthy as they appear.  The Summ Index is a good example of underlying weakness, and as a measure of Adv/Dec issues and volume, it shows that there is no broad based rally that is usually seen at the end of bear markets.

That being said, markets can continue to rally until the bears run out of money and I expect an 80-90% retracement to SPX 3100-300 similar to Dec 2015 before the next major plunge.  The road to the top could be very winding, however.  There are timing cycles that point to a 10-15% correction starting the next two weeks that will probably be followed bu another strong rally to at least 3000.  Depending on sentiment that may be where a larger retest begins to 2250-450.

Weekly Trade Alert.  The next week or so should provide a top before at least a 10% decline.  My target for a top is SPX 2950-75 and for a bottom is 2600-50.  Updates @mrktsignals.

Investment Diary,  Indicator Primer,
 update 2020.02.07 Data Mining Indicators,
 update 2019.04.27 Stock Buybacks,
 update 2018.03.28 Dumb Money/Smart Money Indicators

Article Index 2019 by Topic, completed thru EOY 2020.02.04
Article Index 2018 by Topic
Article Index 2017 by Topic
Article Index 2016 by Topic

Long term forecasts

© 2020 SentimentSignals.blogspot.com

Saturday, May 2, 2020

Time for a B-Wave?

Last week I was looking for a "buy the rumor" EOM rally to SPX 2900+, anticipating the "reopening" of America on May 1, followed by a "sell the news" with a decline by Fri close to the 2800-50 area using the SPX options OI support zones.  In fact the rally spiked all the way to SPX 2950 Wed on the news of Gilead's drug trials for Covid-19 before a sharp retrace to 2820 by Fri.

"Sell in May" may have become too popular short term with a sharp pickup in put/call ratios on Fri and the TRIN showing its highest reading since early Mar at 1.8.  What this does ST is raise the possibility of a corrective reversal to new highs (b-wave) before the decline continues.  Over the last two weeks, I have mentioned the potential for a more complex tops and bottoms for a retrace and retest of the lows similar to Mar-Apr 2018 after the Feb 2018 volmageddon.  The chart below shows an example from 2018.  Currently, I am looking at this as a 40% probability and it should be evident early next week if there is a lack of follow thru to the downside.  The potential is for a low above SPX 2800, a mid week rally possibly to SPX 2850-75, a retest of the lows, then a rally back to SPX 2950+ by May 15 optn exp.  The preferred scenario at 60% is a low next week at SPX 2750-800, then a rally into optn exp to 2900-30.


I. Sentiment Indicators

The overall Indicator Scoreboard (INT term, outlook two to four months) bearish sentiment has moved well below that seen for Mar 2018 and Dec 2018 down legs which is to be expected since the Mar decline was 7% and Dec 2018 was 15%.  A retest of the lows in 2020 would be a decline over 20%.


The INT view of the Short Term Indicator (VXX $ volume, no SPX vol adj, and Smart Beta P/C [ETF Puts/Equity Calls], outlook two to four months) bearish sentiment fas seen a similar drop below neutral to levels comparable for a low retest.


Bonds (TNX).  Bearish sentiment is at extreme lows.


For the INT outlook with LT still negative, the gold miners (HUI) bearish sentiment remains at extreme lows as HUI prices are more reflective of the deflationary prices of bonds.


II. Dumb Money/Smart Money Indicators

The option-based Dumb Money/Smart Money Indicator as short/INT term (outlook 2 to 4 mns/weeks) bearish sentiment bounced of recent lows similar to the Jan and Dec 2018 tops and may be following the pattern of the Dec 2019 price highs.


And the sister options Hedge Ratio sentiment is closer to neutral, indicating the volatility is unlikely to be as extreme as Mar 2020 or Feb and Dec 2018 if there is a retest of the lows.


III. Options Open Interest

Using Thur closing OI, remember that further out time frames are more likely to change over time, and that closing prices are more likely to be effected. Delta hedging may occur as negative reinforcement when put support is broken or call resistance is exceeded.  This week I will look out thru May 8. Also, This week includes a look at the GDX for May exp.

Note, the high pit/calls seen during Fri decline are not reflected in the data shown as of Thur close, so put support is likely to be much higher.  Watch for Mon update (Twitter).

With Fri close at SPX 2831, options OI for Mon is moderate and shows call resistance at SPX 2860 and put support at 2780.  Fri decline probablly increased support from 2800-10,


Wed has much smaller OI where SPX and currently shows potential for a whipsaw if an early week rally reaches SPX 2850 to back toward 2800.


For Fri, moderate overall OI shows only light call resistance at SPX 2850 and 2900 with put support at 2780.  With strikes between SPX 2800 and 2900 hedged, changes due to Fri decline and daily price action will likely determine bias.


Using the GDX as a gold miner proxy closing at 33.30 has pushed over call resistance at 30 and 32 with stronger resistance at 36.  Strength in SPX into optn exp could pressure price down toward 30 level.


Currently the TLT is 168 with the TNX at 0.64% with the strong call resistance at 170. 

IV. Technical / Other

This week I wanted to update a couple of LT outlooks for the NYSE Up/Dn vol and AD Line.  The Up/Dn Vol continues to follow the pattern seen after the Aug 2015 flash crash which consisted of a retest of the lows, a 90%+ retracement before a final lower low to kick of a multi-year rally of almost 100% from the SPX 1800 level.  This is my preferred scenario for 2020-21+.


The NYSE ADLine continues to show strength, indicating that even a partial retrace is likely to be followed by a strong rally that may even make new highs before a more significant down leg as seen of Q4 2018.


Conclusions.  With last weeks spike over SPX 2900, I am updating my extended price range to SPX 2600-3000.  "Is America now open for business, and what will be the result" are the questions whose answers will continue to shape the stock markets performance going forward.  Early indications from other countries and even more lenient US states indicate that open for business also means open for new infections, so an initial sigh of relief may be followed by remorse.  The result could be a lengthy trading range over the summer with a new flu season in the Fall and US elections providing a new round of high risk outcomes.  The alternative, more consistent with previous sharp declines, is a disappointing economic comeback that results in a retest of the SPX lows with new beginnings and medical advances in the Fall that begin a new bull market lasting several years.

Weekly Trade Alert.  Next week is important as bottoming action above SPX 2800 could mean an optn exp rally back to 2950, while a break of 2800 likely means a retest of the lows has begun.  Updates @mrktsignals.

Investment Diary,  Indicator Primer,
 update 2020.02.07 Data Mining Indicators,
 update 2019.04.27 Stock Buybacks,
 update 2018.03.28 Dumb Money/Smart Money Indicators

Article Index 2019 by Topic, completed thru EOY 2020.02.04
Article Index 2018 by Topic
Article Index 2017 by Topic
Article Index 2016 by Topic

Long term forecasts

© 2020 SentimentSignals.blogspot.com