Saturday, December 21, 2024

The Christmas 2024 Edition

Two weeks ago I began warning that a large negative bias was present in the SPX Dec 20 options open int.  At this point I should confess that I have been using $ OI base on 1 share/contract so that amounts are actually 100 times what was stated, and a note was added this week.  The warning was that weakness similar to the Nov exp was expected, but in Nov there was a negative call bias of $350B whereas in Dec the bias was $1.6T or almost 5 times as much, so after the FOMC decision, which was widely expected, options dealers started selling futures creating a spiral of falling prices with stops triggering the last hour.  The BE for the Fri AM was SPX 5900, but I had expected it to hold and instead prices fell to a low of 5830 before a strong reversal.  Sentiment, however, is much the same as after a longer selloff over the month of Sep 2021 which was followed by a multi-month rally of about 10% (see  Tech/Other) into the Jan 2022 top.  This could mean an Apr-May top in 2025.

One thing that was glossed over by the media were the comments that Powell made with the FOMC decision about bitcoin ($BTCUSD).  Essentially he said (no J/S) that the Fed was not authorized to hold crypto and indicated skepticism about holding speculative assets.  Likely this means that Congress, Treasury and the Fed all need to agree on setting us a strategic reserve of bitcoin.  Probably, a new more receptive Fed appointed by Trump in 2026 is needed.  An interesting EW scenario by Dr. Shure discusses one way this could playout with a 50% correction in BTC into 2026 before a SC5 blowoff.  In case this does work out I have decided to add an occasional options OI for IBIT the Blackrock BTC ETF starting this week.

ST sentiment is now at a strong Buy, but still faces the large call wall at SPX 6050 at Dec EOM.


I. Sentiment Indicators

The INT/LT Composite indicator (outlook 3 to 6+ months) has three separate components. Starting Aug 26, 2023 SPX options are removed due to extreme 0DTE volume distortions. New weights are ETF put-call indicator (30%), SPX 2X ETF INT ratio (40%), and 3rd a volatility indicator (30%) which combines the options volatility spread of the ST SPX (VIX) to the ST VIX (VVIX) with the UVXY $ volume.

Update Alt, INT view. Bearish sentiment remained in a narrow range.

Update Alt EMA. Bearish sentiment remained in a narrow range. The ST Composite as a ST (1-4 week) indicator includes the NYSE volume ratio indicator (NYDNV/NYUPV & NYDNV/NYDEC) and the UVXY $ Vol/[SPX Trend, SMA only]. Weights are 80%/20%.

Update. Bearish sentiment rose from a weak Buy to a strong Buy.

Update EMA. Bearish sentiment rose from a weak Buy to a strong Buy. The ST VIX calls and SPXADP indicator bearish sentiment rose from a weak Buy to a strong Buy.
The ST/INT Composite indicator (outlook 1 to 3 months) is based on the Hedge Spread (48%) and includes ST Composite (12%) and three options FOMO indicators using SPX (12%), ETF (12%), and Equity (12%) calls compared to the NY ADV/DEC issues (inverted). FOMO is shown when strong call volume is combined with strong NY ADV/DEC. See Investment Diary addition for full discussion.

Update EMA. Bearish sentiment continued to rise but remained below neutral.

Bonds (TNX)Bearish sentiment remains at extreme lows as TNX rates reached the top of what appears to be a bullish flag (down slope trend). For the INT outlook, the gold miners (HUI) bearish sentiment is presented in a new format using the data mining software to add the inverse TNX rate to the ETF ratio.

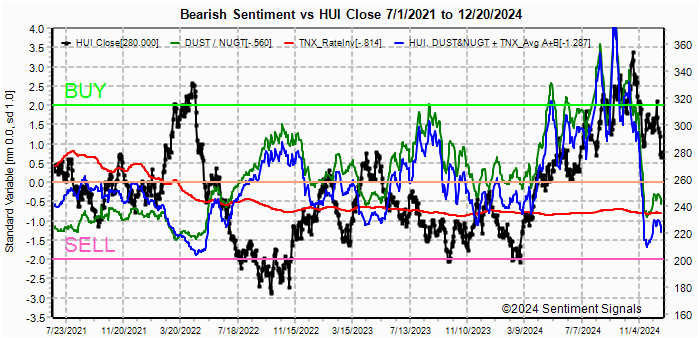
Update. Bearish sentiment remains below a weak Sell, where sentiment and prices trend look similar to mid-2022 and from a slightly higher level which could mean a lower target around HUI 200.


II. Dumb Money/Smart Money Indicators

This is a new hybrid option/ETF Dumb Money/Smart Money Indicator as a INT/LT term (outlook 2-6 mns) bearish sentiment indicator. The use of ETFs increases the duration (term).

Update. Bearish sentiment is little changed.

With the sister options Hedge Spread as a ST/INT indicator (outlook 1-3 mns), bearish sentiment declined slightly and remains at dangerous levels. A new composite SPX options indicator uses both the volume adj (1/B-A) and P/C equivalent spread (A-B) to compensate for the discrepancy between the two.  This replaces the old SPX options indicator for the SPX ETFs + options below and the INT/LT composite. No chart.

For the SPX, I am switching to hybrid 2X ETFs plus SPX options. Taking a look at the INT term composite (outlook 2 to 4 mns), bearish sentiment remains near neutral.

For the NDX combining the hybrid ETF options plus NDX 3X ETF sentiment with the interest rate effect,  (outlook 2 to 4 mns) bearish sentiment shows similar extremes between ETF and options as in late 2020 which resulted in a choppy market until options sentiment rose.  Note QQQ options are optimal, but are N/A and are included in ETF options.

Bearish sentiment remains below a weak Sell with weak hedging.

For the SPX combining the hybrid ETF options plus SPX 2X ETF (outlook 2 to 4 mns) produces an indicator where, in this case, ETF options are a proxy for the SPY options.

Bearish sentiment for SPX is little changed.


III. Options Open Interest

Using Thur closing OI, remember that further out time frames are more likely to change over time, and that closing prices are more likely to be effected. Delta hedging may occur as reinforcement, negative when put support is broken or positive when call resistance is exceeded.  This week I will look out thru Dec 31. A text overlay is used for extreme OI to improve readability, P/C is not changed. Also, this week includes a look at the GDX for Dec exp.   A new addition is added for OI $ amounts with breakeven pts (BE) where call & put $ amounts cross. Note multiply OI$ by 100 for shares/contract.

With Fri close at SPX 5931, options OI for Mon is moderate with strong put support to the low 5900s should see 5900+ (Sat debt ceiling passed).
Wed is Xmas holiday, best wishes.

For Fri SPX OI is small, but prices could push toward BE at mid-6000s.

For Tue Dec 31, SPX OI is large with very strong call resistance at 6050 and a BE at 6000, indicating a target of 6000-50 or lower.
Using the GDX (Jan not Jab) as a gold miner proxy closing at 34.3 shows a BE at 35 with strong put support at 33 and call resitance at 37.  Not much bias either way.

Currently the TLT is 88.3 with the TNX at 4.52%, have fallen thru strong put resistance at 90 and could fall toward 87 with BE at 93.  ETF sentiment above is a negative.

Currently the IBIT is 54.8 with $BTCUSD at 96.9k, low P/C is one reason why BTC is weak with lower put support  at 48-9


IV. Technical / Other

Several months ago, I tried to setup a more complex composite to mirror the earlier composites before I started the data mining project.  As it turns out, it works pretty well as a ST/INT indicator although there a too many lines to read, but the EMAs are clearer.

Called the Technical Indicator Composite, the past several months have shown sentiment similar to mid-2021 with the current sentiment matching that of the Sept 2021 decline which was followed from a 10%+ rally from below SPX 4300 to 4800+ for the next four months to Jan 2022.  From the 5830 low, a 10% rally is 6400+.

The following uses barcharts.com as a source and discusses S&P futures (ES) as a third venue of stock sentiment in addition to options and ETFs.  The non-commercial/commercial spread represents a LT bearish sentiment (dumb money/smart money) indicator. As explained in investopedia, commercial investors (red) are institutions and are smart money, while non-commercials (green) are speculators such as hedge funds and are dumb money. Here is the current  barchart graph for the S&P 500 (top) and trader positions (1st bot) with positives as net longs and negatives as net shorts.  Bearish sentiment is represented by the spread and is positive if red > green (Buy) and negative if green > red (Sell).  ES (SPX) sentiment remains a positive +0.25 SD, NQ (NDX) bearish sentiment remains  a strong Sell at -2.25 SD, YM (DJIA) remains a weak Sell -1.0 SD.

Click dropdown list to select from the following options:

Tech / Other History
2024

2023

2022

Other Indicators

Conclusions.  Although ST sentiment is showing a strong Buy, the INT/LT sentiment, including the hedge spread remain weak, so although I think the markets may rally for several months, it is likely to remain fairly volatile.

Weekly Trade Alert.  SPX options OI is indicating that a rally into the low-mid 6000s is possible next week, starting with news of a budget compromise, but a pullback is likely into EOM.  Updates @mrktsignals.

Investment DiaryIndicator Primer, Tech/Other Refs,
 update 2021.07.xx  Data Mining Indicators - Update, Summer 2021,
 update 2020.02.07 Data Mining Indicators,
 update 2019.04.27 Stock Buybacks,
 update 2018.03.28 Dumb Money/Smart Money Indicators

Article Index 2019 by Topic, completed thru EOY 2020.02.04
Article Index 2018 by Topic
Article Index 2017 by Topic
Article Index 2016 by Topic

Long term forecasts

© 2024 SentimentSignals.blogspot.com

Saturday, December 14, 2024

Could Santa Disappoint This Year?

Could Santa Disappoint This Year?

Last week the ST sentiment indicators were neutral, and the SPX options OI was indicating a tight range (6050-75) at the close with a Friday target of 6050 after the previous Friday closed at 6090.  In fact daily SPX closes were 6053, 6035, 6084, 6051, 6051, so about as good as possible.  This week, the ST indicators, both ST Composite an VIX calls & SPXADP are at weak Buys with SPX options OI supportive of a move into the top of the current range 6080-90 into Wed, but the Fri monthly call OI$ may present a problem, although SPX 6000 or lower may be difficult to reach.

A look farther out to the EOM shows a huge call wall at 6050 (likely JPM hedged fund) and may limit further upside until Jan.  With a continuing strong economy, EPS season starting mid-Jan could be the start of the next rally phase.

Discuss.


I. Sentiment Indicators

The INT/LT Composite indicator (outlook 3 to 6+ months) has three separate components. Starting Aug 26, 2023 SPX options are removed due to extreme 0DTE volume distortions. New weights are ETF put-call indicator (30%), SPX 2X ETF INT ratio (40%), and 3rd a volatility indicator (30%) which combines the options volatility spread of the ST SPX (VIX) to the ST VIX (VVIX) with the UVXY $ volume.

Update Alt, INT view. Bearish sentiment increased slightly.

Update Alt EMA. Bearish sentiment increased slightly. The ST Composite as a ST (1-4 week) indicator includes the NYSE volume ratio indicator (NYDNV/NYUPV & NYDNV/NYDEC) and the UVXY $ Vol/[SPX Trend, SMA only]. Weights are 80%/20%.

Update. Bearish sentiment rose sharply from above neutral to above a weak Buy.

Update EMA. Bearish sentiment rose to a weak Buy.
The ST VIX calls and SPXADP indicator bearish sentiment rose above neutral to a weak Buy.
The ST/INT Composite indicator (outlook 1 to 3 months) is based on the Hedge Spread (48%) and includes ST Composite (12%) and three options FOMO indicators using SPX (12%), ETF (12%), and Equity (12%) calls compared to the NY ADV/DEC issues (inverted). FOMO is shown when strong call volume is combined with strong NY ADV/DEC. See Investment Diary addition for full discussion.

Update EMA. Bearish sentiment rose above a weak Sell.

Bonds (TNX)Bearish sentiment remains at extreme lows as rates rose from 4.15% to 4.4% in one week after taking two weeks to drop from 4.5%. For the INT outlook, the gold miners (HUI) bearish sentiment is presented in a new format using the data mining software to add the inverse TNX rate to the ETF ratio.

Update. Bearish sentiment remained at a weak Sell as prices whipped from 330 to 300.


II. Dumb Money/Smart Money Indicators

This is a new hybrid option/ETF Dumb Money/Smart Money Indicator as a INT/LT term (outlook 2-6 mns) bearish sentiment indicator. The use of ETFs increases the duration (term).

Update. Bearish sentiment increased slightly.

With the sister options Hedge Spread as a ST/INT indicator (outlook 1-3 mns), bearish sentiment rose back to a weak Sell. A new composite SPX options indicator uses both the volume adj (1/B-A) and P/C equivalent spread (A-B) to compensate for the discrepancy between the two.  This replaces the old SPX options indicator for the SPX ETFs + options below and the INT/LT composite. No chart.

For the SPX, I am switching to hybrid 2X ETFs plus SPX options. Taking a look at the INT term composite (outlook 2 to 4 mns), bearish sentiment declined for both options and ETFs tp near neutral.

For the NDX combining the hybrid ETF options plus NDX 3X ETF sentiment with the interest rate effect,  (outlook 2 to 4 mns) bearish sentiment shows similar extremes between ETF and options as in late 2020 which resulted in a choppy market until options sentiment rose.  Note QQQ options are optimal, but are N/A and are included in ETF options.

Bearish sentiment rose from a strong Sell.

For the SPX combining the hybrid ETF options plus SPX 2X ETF (outlook 2 to 4 mns) produces an indicator where, in this case, ETF options are a proxy for the SPY options.

Bearish sentiment for SPX rose above a weak Sell.


III. Options Open Interest

Using Thur closing OI, remember that further out time frames are more likely to change over time, and that closing prices are more likely to be effected. Delta hedging may occur as reinforcement, negative when put support is broken or positive when call resistance is exceeded.  This week I will look out thru Dec 20. A text overlay is used for extreme OI to improve readability, P/C is not changed.  A new addition is added for OI $ amounts with breakeven pts (BE) where call & put $ amounts cross.

With Fri close at SPX 6051, options OI for Mon is moderate with strong put support up to 6040 and little call resistance until 6150, but OI$ may limit upside over BE.
Wed has smaller SPX OI with some put support up to 6075 and BE at 6070, so prices may rise to the top of the current range.
For Fri AM very strong SPX call ITM OI$ (net $11B) could indicate a weak open following FOMC on Wed.
For Fri PM moderate SPX OI shows strong call resistance at 6100, and little put support until 5800.
For Dec 31 EOM, SPX has strrong OI with a huge call wall at 6050, likely the JPM hedged fund, and put support at 6000.  A possible EOM target of 6000-50.

IV. Technical / Other

Last week, I showed the history of the SKEW where the EMAs in record territory since Trump one served as an early warning of an important top several months in advance.  This week I want to look at the NYSE Up/Down volume EMAs.  Comparing to the tops from last week in late 2018 and 2021, both times the 100 day EMA fell to 1.5 about 1 month before the SPX topped.  Currently the EMAs are falling but may be several months from a Sell.
The following uses barcharts.com as a source and discusses S&P futures (ES) as a third venue of stock sentiment in addition to options and ETFs.  The non-commercial/commercial spread represents a LT bearish sentiment (dumb money/smart money) indicator. As explained in investopedia, commercial investors (red) are institutions and are smart money, while non-commercials (green) are speculators such as hedge funds and are dumb money. Here is the current  barchart graph for the S&P 500 (top) and trader positions (1st bot) with positives as net longs and negatives as net shorts.  Bearish sentiment is represented by the spread and is positive if red > green (Buy) and negative if green > red (Sell). ES (SPX) sentiment continued its reversal to a positive +0.25 SD, NQ (NDX) bearish sentiment increased to a stronger Sell at -2.25 SD, YM (DJIA) remains a weak Sell -1.0 SD.

Click dropdown list to select from the following options:

Tech / Other History
2024

2023

2022

Other Indicators

Conclusions.   Consensus is that high consumer sentiment will be enough to end the bull market in stocks, but money flows into options and ETFs is telling us that investor sentiment is still moderately bearish and will continue to support higher prices for several months.

Weekly Trade Alert.  A move into the top of the current range (SPX 6080-90) looks likely into Wed, but post-FOMC is unclear as large ITM call positions Fri AM & PM could put downward pressure on stocks.  Updates @mrktsignals.

Investment DiaryIndicator Primer, Tech/Other Refs,
 update 2021.07.xx  Data Mining Indicators - Update, Summer 2021,
 update 2020.02.07 Data Mining Indicators,
 update 2019.04.27 Stock Buybacks,
 update 2018.03.28 Dumb Money/Smart Money Indicators

Article Index 2019 by Topic, completed thru EOY 2020.02.04
Article Index 2018 by Topic
Article Index 2017 by Topic
Article Index 2016 by Topic

Long term forecasts

© 2024 SentimentSignals.blogspot.com

Saturday, December 7, 2024

Early Warning Signs of an Important Top Appearing

Early Warning Signs of an Important Top Appearing

Last week I was noncommittal and the SPX continued its crawl higher bolstered by techs as several Trump appointees were tech and crypto friendly which helped the NDX and BTC advance to new highs and the cyclicals languished.  As a result the SPX advanced about 1% hitting 6100.  The largest changes in sentiment were the COT where SPX/ES moved from a weak Sell to neutral and NDX/NQ moved to a strong Sell, and the Skew and VIX term structure which reached record levels.  Since Trumps first term the Skew saw record levels (for Stockcharts since 1990) in July 2018, 3 mns before the Oct top and in 2021 6 mns before the Jan 2022 top.  Peaks in the Skew seem to correspond with peak bearishness which tends to be followed by a blowoff rally then a collapse.  More in Tech/Other section.

ST sentiment seems rather boring as the ST Composite remains slightly positive and the VIX call indicator has returned to neutral.  A look at the SPX options for this coming week and opt exp (FOMC) week shows a similar setup to Nov with strong put support next week and huge call positions for opt exp week, so an up/flat then down for the next two weeks would not surprise.


I. Sentiment Indicators

The INT/LT Composite indicator (outlook 3 to 6+ months) has three separate components. Starting Aug 26, 2023 SPX options are removed due to extreme 0DTE volume distortions. New weights are ETF put-call indicator (30%), SPX 2X ETF INT ratio (40%), and 3rd a volatility indicator (30%) which combines the options volatility spread of the ST SPX (VIX) to the ST VIX (VVIX) with the UVXY $ volume.

Update Alt, INT view. Bearish sentiment remains near a weak Sell.

Update Alt EMA. Bearish sentiment improved slightly. The ST Composite as a ST (1-4 week) indicator includes the NYSE volume ratio indicator (NYDNV/NYUPV & NYDNV/NYDEC) and the UVXY $ Vol/[SPX Trend, SMA only]. Weights are 80%/20%.

Update. Bearish sentiment moved above neutral.

Update EMA. Bearish sentiment remains modestly positive.
The ST VIX calls and SPXADP indicator bearish sentiment moved up from a weak Sell toward neutral.
The VST VIX calls and SPXADP indicator is included to show more detail.
The ST/INT Composite indicator (outlook 1 to 3 months) is based on the Hedge Spread (48%) and includes ST Composite (12%) and three options FOMO indicators using SPX (12%), ETF (12%), and Equity (12%) calls compared to the NY ADV/DEC issues (inverted). FOMO is shown when strong call volume is combined with strong NY ADV/DEC. See Investment Diary addition for full discussion.

Update EMA. Bearish sentiment moved from a strong Sell to weak Sell.

Bonds (TNX)Bearish sentiment remains at low extremes. For the INT outlook, the gold miners (HUI) bearish sentiment is presented in a new format using the data mining software to add the inverse TNX rate to the ETF ratio.

Update. Bearish sentiment move up to a weal Sell as NUGT volume increased.


II. Dumb Money/Smart Money Indicators

This is a new hybrid option/ETF Dumb Money/Smart Money Indicator as a INT/LT term (outlook 2-6 mns) bearish sentiment indicator. The use of ETFs increases the duration (term).

Update. Bearish sentiment improved modestly to a weak Sell.

With the sister options Hedge Spread as a ST/INT indicator (outlook 1-3 mns), bearish sentiment remains close to a strong Sell. A new composite SPX options indicator uses both the volume adj (1/B-A) and P/C equivalent spread (A-B) to compensate for the discrepancy between the two.  This replaces the old SPX options indicator for the SPX ETFs + options below and the INT/LT composite. No chart.

For the SPX, I am switching to hybrid 2X ETFs plus SPX options. Taking a look at the INT term composite (outlook 2 to 4 mns), bearish sentiment remains modestly above neutral.

For the NDX combining the hybrid ETF options plus NDX 3X ETF sentiment with the interest rate effect,  (outlook 2 to 4 mns) bearish sentiment shows similar extremes between ETF and options as in late 2020 which resulted in a choppy market until options sentiment rose.  Note QQQ options are optimal, but are N/A and are included in ETF options.

Bearish sentiment remains near a strong Sell.

For the SPX combining the hybrid ETF options plus SPX 2X ETF (outlook 2 to 4 mns) produces an indicator where, in this case, ETF options are a proxy for the SPY options.

Bearish sentiment for SPX improved slightly to a weak Sell.


III. Options Open Interest

Using Thur closing OI, remember that further out time frames are more likely to change over time, and that closing prices are more likely to be effected. Delta hedging may occur as reinforcement, negative when put support is broken or positive when call resistance is exceeded.  This week I will look out thru July 16. A text overlay is used for extreme OI to improve readability, P/C is not changed. Also, this week includes a look at the GDX for Dec exp.   A new addition is added for OI $ amounts with breakeven pts (BE) where call & put $ amounts crossand $ volume.

With Fri close at SPX 6090, options OI for Mon is moderate showing a large increase in OTM puts (Skew) showing a positive  bias for P/C while ITM options show a stronger negative bias for $OI.  A small range of 6050 to 6075 is most likely, while delta hedging can exaggerate a breakout either way.
Wed has somewhat smaller OI where SPX has a similar bias.
For Fri stronger SPX OI call resistance over 6050 may cause a retrace to that level.
For opt exp Fri Dec 20 strong SPX OI shows a huge net bullish position of $11B that could see s reversal down to 6000 or lower much like the Nov opt exp.


IV. Technical / Other

This week I wanted to take a LT look at the $SKEW which has reached record highs for the EMAs since 1990s.  Typically the SKEW has been an early, but dependable predictor of INT/LT tops for the SPX.  The SKEW is a measure of OTM option premiums, esp puts.  Looking at the INT tops since Trump one, and excluding 2019-20 as event driven (Covid), this leaves 2018 and 2021.  Following the peaks in SKEW, in 2018 the SPX advanced for 3 mns and 3% higher, while in 2021 the SPX advanced for 6 mns and 12% higher.  The SKEW may not have peaked yet, but when it does, it's reasonable to expect a top 3 to 6 mns later with an advance of 3 to 12% or 6250 to 6800 from current levels.

For the "in-house", I use a combo of Skew and VIX term structure (VIX/VV) which shows the same sentiment.  In both charts, an increasingly high Skew was followed by a larger decline (sentiment shows same) so eventual decline should be larger than 2022.

The following uses barcharts.com as a source and discusses S&P futures (ES) as a third venue of stock sentiment in addition to options and ETFs.  The non-commercial/commercial spread represents a LT bearish sentiment (dumb money/smart money) indicator. As explained in investopedia, commercial investors (red) are institutions and are smart money, while non-commercials (green) are speculators such as hedge funds and are dumb money. Here is the current  barchart graph for the S&P 500 (top) and trader positions (1st bot) with positives as net longs and negatives as net shorts.  Bearish sentiment is represented by the spread and is positive if red > green (Buy) and negative if green > red (Sell).  ES (SPX) sentiment saw a huge reversal to a positive +0.1 SD, NQ (NDX) bearish sentiment increased to a strong Sell at -2.0 SD, YM (DJIA) remains a weak Sell -1.0 SD.

Click dropdown list to select from the following options:

Tech / Other History
2024

2023

2022

Other Indicators

Conclusions.   The recent increase in put buying, as evidenced by the Skew and SPX P/C which Fri jumped to 1.58, the highest since a 1.59 on Nov 1 before the election, should serve as a warning for the bears and could result in a final blowoff rally over the next few months.  Next week is CPI/PPI on Wed/Thur that cause some volatility as prices remain "sticky" although oil prices remain low and may help dampen price pressure.  Next is FOMC Dec 18.

Weekly Trade Alert.  Next week is likely to see limited movement and could be a setup for a move to SPX 6000 or lower for opt exp week Dec 20.  Updates @mrktsignals.

Investment DiaryIndicator Primer, Tech/Other Refs,
 update 2021.07.xx  Data Mining Indicators - Update, Summer 2021,
 update 2020.02.07 Data Mining Indicators,
 update 2019.04.27 Stock Buybacks,
 update 2018.03.28 Dumb Money/Smart Money Indicators

Article Index 2019 by Topic, completed thru EOY 2020.02.04
Article Index 2018 by Topic
Article Index 2017 by Topic
Article Index 2016 by Topic

Long term forecasts

© 2024 SentimentSignals.blogspot.com