This weekend I was watching a Brad Pitt movie from a couple of years ago called "World War Z", one of the many zombie apocalypse movies over the last few years. Two things struck as similar to modern day economics, the first is the contagion of modern day central banking and the second is the Israeli "tenth man rule". Israel was the only country to anticipate the contagion by agreeing to use a committee of ten decision makers where nine agreeing on one outcome would default to the decision of the contrary vote. Is there more than one of ten that does not agree that much higher prices are ahead?
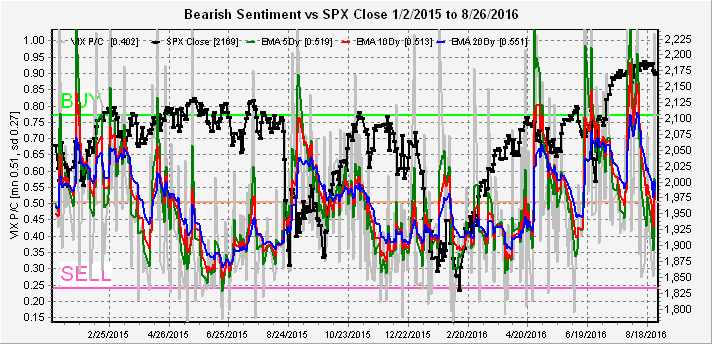
Most of my indicators are repeating a pattern seen between May and July of 2015. This weekend I will follow a pattern starting with the individual indicators and conclude with the composites. First is the VIX P/C which is an almost identical position to early May 2015, where blossoming bearish sentiment (low VIX P/C) saw a last gasp rally to new highs. Capitulation by the bears was shown by a spike in the VIX P/C.
The Short Term Indicator (VXX $ vol & Smart Beta P/C) continues to show similarity to the July 2015 period, pointing to less upside potential and a shorter consolidation period ahead. The money flow indicator SPXU/UPRO is very similar to the Short Term Indicator, having retreated to slightly below the mean.
The overall Scoreboard Composite is somewhat in between the two indicators show above, but shows that this is not the time to be overly complacent.
Conclusion. The topping process continues. September's high volume on a pullback is somewhat bullish short term, but the lack of a panic low makes me suspicious of the sustainability of any rally.
Weekly Trade Alert. Long entry target was not meet last week, and I prefer to hold off and look for a good shorting opportunity which could come over the next two or three weeks.
Most of my outside projects are nearing completion, so I will be able to devote more time to analyzing sentiment trends. Of note last week, the bearish levels of the Short Term Indicator components (VXX $ Volume and Smart Beta P/C) soared, while the overall P/C ratios were more subdued (declining VIX P/C). Also, the SKEW has been accurately forecasting market moves rising to the mid 130s before a decline and dropping to the mid 120s before rallies, with Friday's close at 125 being short term bullish. I will also be looking at some of the ETF ratios including the SPXU/UPRO and DUST/NUGT.
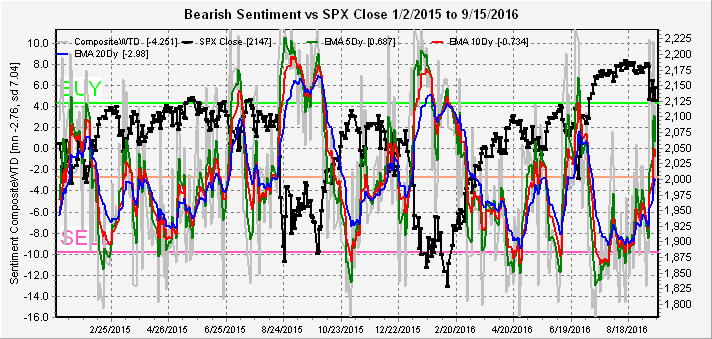
The overall Indicator Scoreboard continues to mimic the first half of 2015. Rising from a more extreme low, this indicator is approaching levels of the March 2015 decline and has increased almost as much as the early July 2015 decline.
The Short Term Indicator has risen more sharply with the medium term EMAs approaching the early July 2015 level. This indicates that a rally to test the ATH at SPX 2194 is likely to start next week.
Several times,I have referred to the SPXU/UPRO ratio as an excellent short term indicator and this time it seems to agree with the Short Term Indicator by showing behavior that mimics the July 2015 period. This points to the possibility of a fast and furious rally that is likely to fail.
For the last of the market indicators, the VIX P/C continues decline as expected, now approaching the equivalent of April 2015.
Finally, the gold miners ETF ratio DUST/NUGT. As it turns out, by waiting a couple of weeks, the effects of the double split worked themselves out so no smoothing was needed. This is definitely looking like a topping formation with a clear reverse mirror image to the last half of 2015.
Conclusion. It still continues to look like that by the end of the year gold miners, bonds and the general stock market will be in decline. For the general market the most likely period seems to be November for the final high which for now my guess is in an SPX range of 2185 to 2215.
Weekly Trade Alert. A rally is likely to start by mid-week. I doubt the FOMC will raise rates before the election, but even so, any decline is likely to be brief and shallow. Ideally, I want to go long at 2115 with a stop at 2100 and a target of 2185.
The weekend post is a day late, partially due to a busy schedule and waiting to see if there would be follow thru on Friday's decline. As I have been pointing out for weeks, my preferred scenario for a top was a Jan-May 2015 type top which saw a lot of volatility within a range of about 100 SPX points, but thru Thursday there was very little volatility. My indicators have been neutral for several weeks, so the sudden decline to SPX 2019 was unexpected other than a one day spike in VIX call buying on Thursday and a day later we are back to 2060. Still haven't adjusted DUST/NUGT for split.
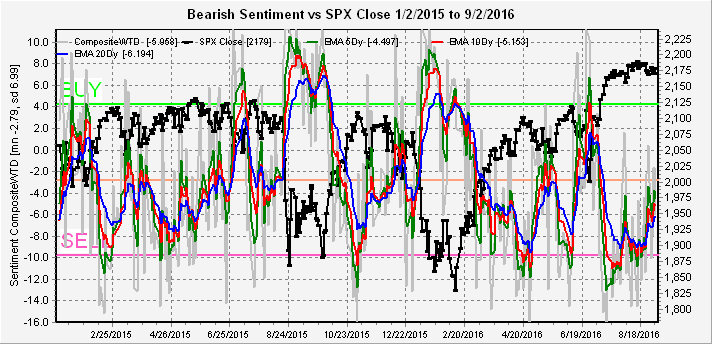
The overall Indicator Scoreboard (Friday) has spiked up to the mean, well within the early 2015 pattern. Overall, the timing seems to be like early May 2015 where a pickup in volatility occurred before the run to the May top. Also the significant decline did not happen until two months later in July, which would be equivalent to November 2016.
The Short Term Indicator was also stopped at the mean.
The VIX P/C EMAs are also locked in a very tight range, again similar to early May 2015 and are expected to drop before a more significant decline.
Conclusion. As you may have noticed my strength is not day trading, as I have found too often that whipsaws often catch you leaning in the wrong direction.
Weekly Trade Alert. Still not willing to make any commitment. Hopefully, I will be more focused when my outside projects are completed.
As expected, the Initial Unemployment Claims correctly forecast a weaker jobs report on Friday than last month with a resulting bounce from the 2160 area I expected. From a trading perspective, however, most of the week looked like distribution with early morning selloffs followed by slow rallies throughout the day, so I did not play the rally. Not much change in the indicators with mostly neutral readings. With football season beginning, I would compare this to halftime with the bulls ahead in the score, the only question is whether the second half will see a change in momentum.
The overall Indicator Scoreboard is little changed from last week.
The Short term Indicator has also flattened out with a slightly negative bias.
The VIX P/C is also little changed, hovering near the mean.
Conclusion. There is little reason for excitement, as the indicators continue to grind sideways in a pattern most similar to the first half of 2015. Still working on the DUST/NUGT splits, so no results until next week.
Weekly Trade Alert. The daily trading patterns last week kept me from going long at SPX 2160, but I doubt that the current rally exceeds 2185 for long and is likely to revisit the 2160 area soon. No trades for now.
Last weeks forecasted trading range worked out almost perfectly with a high in the SPX mid 2190s followed by a drop to 2160, but I missed the entry point for a short by three points. Overall bearish sentiment has become less extreme, allowing for a continuation of the rally (early 2015 scenario). The key for the next week to ten days are the unemployment numbers on Friday. A repeat of the strength last month will increase the likelihood of FED tightening. I always look at the FRED's Initial (Unemployment) Claims/1 year chart as an indicator, high claims means lower jobs numbers and that is exactly what happened last month. So this report may be just right to support a rally back to the SPX 2200 level.
For this week's sentiment indicator review, I will only cover the overall Indicator Scoreboard, the Short Term Indicator (VXX $ vol & Smart Beta P/C), and the VIX P/C. There were 5 to1 splits in both the NUGT and DUST ETFs last week, so I need to do another smoothing algorithm and will report the results next week.
The Indicator Scoreboard continues to show a similar pattern to the topping pattern of early 2015, only this time the over bullishness is even more extreme.
The Short Term Indicator shows a similar pattern only to a less extreme and does not indicate a final top.
The VIX P/C briefly dropped close to the .35 level early last week before the decline showing the effectiveness of this indicator, and then bounced back at the end of the week.
Conclusion. The bankers seem intent on maintaining a sense of calmness going into the election, but will this be only a calm before the storm.
Weekly Trade Alert. I will be going long SPX on a retest of 2160 early in the week with a target around 2200 over the next two weeks with a 15 pt stop.
Over the last few weeks, I have pointed out that low bearish sentiment indicated that some type of top was forming, but comparing the markets to 2015, possibilities included the first half of 2015, June thru July, or Nov thru Dec. More and more, sentiment is becoming similar to the first half of 2015. Most recently, the VIX has been trading in a very narrow band historically, but in early 2015 this continued for four months.
Jumping to the overall Indicator Scoreboard, a lower volatility equivalent of Mar thru April 2015 seems to be occurring.
The Short Term Indicator (VXX $ volume and Smart Beta PC) has also been locked in a tight range similar to Mar thru April 2015.
Looking at the other indicators, the VIX P/C has leveled off around 0.5 and is neutral, one of the most reliable, the Smart Beta P/C continues to decline, but not at the SELL level yet. The SKEW is somewhat worrisome having reached the low 130s, but the end of 2015 saw this level for three months before the Jan selloff. The most worrisome immediately is the money flow indicator or the SPXU/UPRO which remains at the low levels of last week.
Conclusion. It is very possible at this point that a pullback in the SPX of 50 to 100 points occurs before a likely Oct-Nov rally. A possible top around 2200 occurring around the Jackson Hole financial summit could be followed by a pullback to test the May 2015 high at 2135.
Weekly Trade Alert. Short SPX around 2200 +/- 2 or 3 pts. Stop 2215. Target 2160 for now. VIX P/C is still too high to expect a lot of volatility.
Appendix. Last week, I mentioned that the reverse split in the VXX resulted in some unusually low volume readings prior to the split so a smoothing algorithm was applied to smooth out the volume. The first chart is the VXX $ volume for 2015 and 2016 with sentiment bottoming at normal levels (compare to early 2015).
The second chart is of the VXX/XIV from 2013 that shows bottoming sentiment similar to mid-2015.
The last few weeks, I have pointing out that most sharp declines over the last year and a half have happened with low VIX P/C averages, but last week was the first sign of a change in trend from high levels with two days of .32 and .27. The EMAs are still fairly high but a continued downtrend could reach a sell level over the next week or two. Usually a .30 to .35 level is required for a sharp pullback.
Last week saw a 4 for 1 reverse split in the VXX, and the extraordinarily low volume over the last two weeks may be in part due to anticipation of the split. The same behavior occurred a few months ago with the reverse split of the gold miner's ETF DUST. Theoretically, there should be no difference in $ trading volume, but for the VXX the $ volume was 2X after the split compared to before the split. So I am applying an algorithm to the price pattern to smooth the data, and I need another week of data to fine tune the results. As a result, this week I will rely on other indicators.
First taking a look at the overall Indicator Scoreboard (wtd composite), the levels of bearishness are consistent with a topping pattern, but also similar to the first half of 2015.
Another composite that I haven't looked at for a while, the Students Trifecta (VIX term structure, TRIN, and overbought/oversold indicator) is at a lower level than the first half of 2015, but the last time at this level in April only produced a 70 point drop in the SPX.
One of the money flow indicators, the SPXU/UPRO ETF ratio, that has produced reliable short term calls when the 5 day EMA reaches the SELL level is now indicating a SELL. The SDS/SSO ratio has reached levels only seen over the last 18 months at the Feb and Nov 2015 tops.
The last indicator the SmartBeta P/C is somewhat less ominous and is still consistent with the early 2015 topping pattern.
Conclusion. Larger price swings and higher volatility seem likely, but do not rule out a general upward trend into the election. One of the things that I see looking at the bigger picture is that a number of asset classes, including gold, stocks and bonds, seem to be topping together with oil already having broken down. Perhaps this means that the FED will become more serious about normalizing rates, at least after the election, providing headwinds for all assets.
Weekly trading alert. The SKEW is a little high at 132 to support much of a rally during expiration week, but I am reluctant to short unless the VIX P/C drops further. Last week's call eked out a small gain, short SPX at 2185, stopped at 2175. Updates or changes at @mrktsignals.