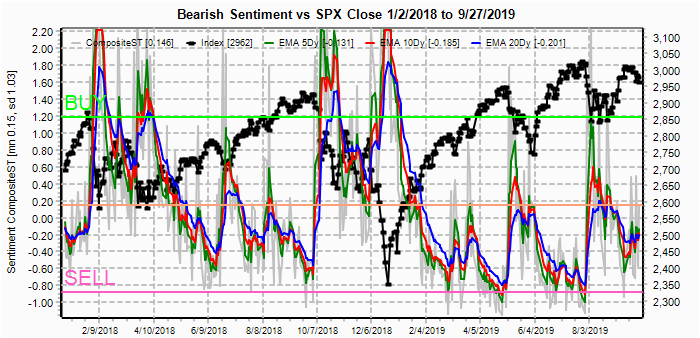
I. Sentiment Indicators
The overall Indicator Scoreboard (INT term, outlook two to four months) bearish sentiment has risen to a level in between the June 2018 and May 2019 lows, so a multi-month low may be in.

The INT view of the Short Term Indicator (VXX $ volume and Smart Beta P/C [ETF Puts/Equity Calls], outlook two to four months) bearish sentiment continues to oscillate around neutral similar to June-Oct 2018 which indicated a rocky advance.

Bonds (TNX). Interest rates fell last based on the weak ISM outlook as did sentiment that may mean a trading range between 1.5% and 2.0% is forming.

For the INT outlook with LT still negative, the gold miners (HUI) bearish sentiment did fall sharply last week as expected with only a minor bounce with the swoon in SPX mid-week. A break below 200 confirms the H&S for the ST with a target of 180.

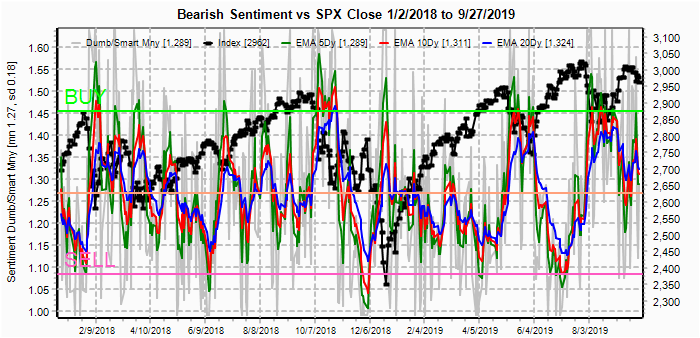
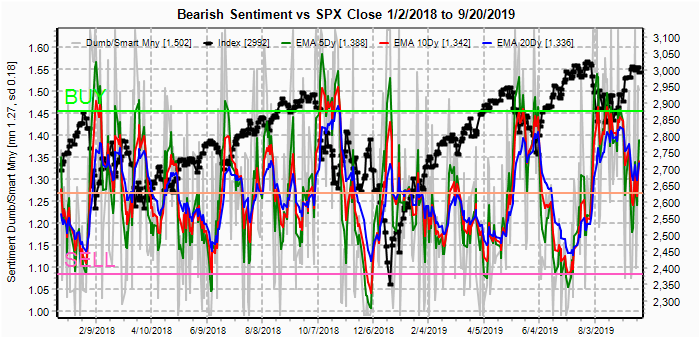
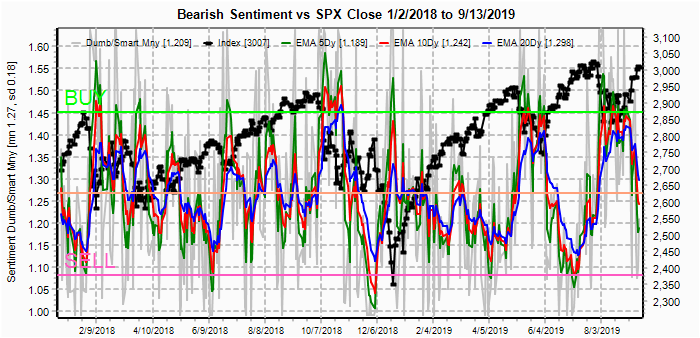
II. Dumb Money/Smart Money Indicators
The option-based Dumb Money/Smart Money Indicator as short/INT term (outlook 2 to 4 mns/weeks) continues in a pattern like Jul-Oct 2018 that implies a positive bias, but not overwhelming strength.
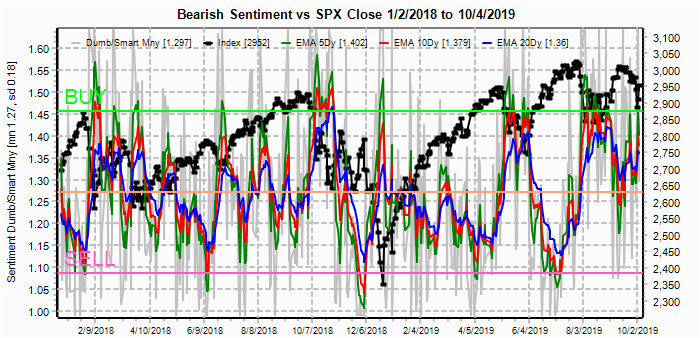
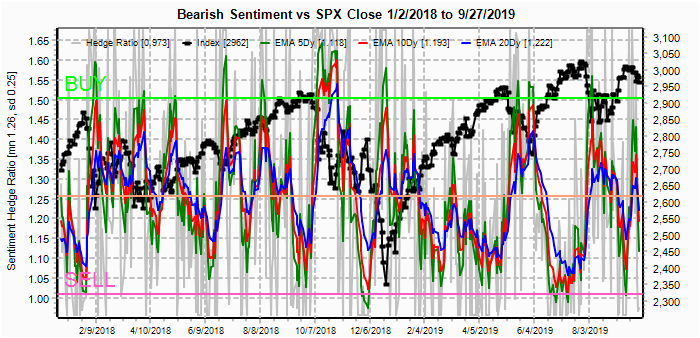
And the sister options Hedge Ratio sentiment has reversed its ST negative bias, also similar to Jul-Oct 2018, but with less strength, implying greater volatility than 2018.

The INT term SPX Long Term/Short Term ETFs (outlook two to four wks/mns) bearish sentiment (2x DM/3x SM) has been gradually improving since June that may indicate a breakout from the SPX 2800-3025 is ahead, and the similarity to Dec 2018 proved accurate with a flush lower. Bearish levels are now approaching those of Mar 2018 that supports an eventual breakout to the upside.

The INT term SPX Long Term (2x/DM) ETFs (outlook two to four weeks) bearish sentiment is approaching that seen at the Aug lows and recent vacillations may be indicative of more of a stair-step advance that seen in Jul-Oct 2018.

The INT term NDX Long Term (2x/DM) ETFs (outlook two to four weeks) bearish sentiment has moved back to the neutral level and is also similar but less positive than Jul-Oct 2018.

III. Options Open Interest
Using Wed close, remember that further out time frames are more likely to change over time, and that closing prices are more likely to be effected. This week I will look out thru Oct 11. Also, This week includes a look at the GDX for Oct.
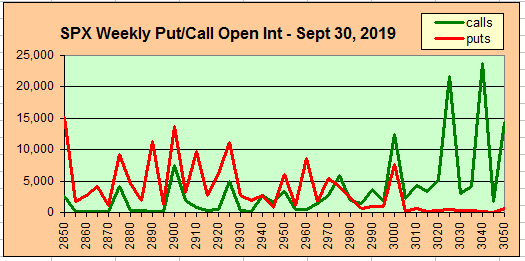
With Fri close at SPX 2952. Although Mon OI is fairly small, last week's volatility increased put support dramatically as long as SPX stays above 2950, there is little call resistance to 3000, although below 2950, put support is also weak until 2875.

Wed shows a potential for a very wide price range, much like last week, where the only significant put support is SPX 2875 and call resistance at 3030.

For Fri, the net result of last week's whipsaw action was to increase put support at SPX 2950 and below and increase call resistance at 2975 and above. The conclusion is a likely tight range of outcomes with the SPX between 2950 and 2975 with a wider band below at 2925 and 2900 and above at 3000. China trade talks may disappoint those taking straddle trades.

Using the GDX as a gold miner proxy. For Oct exp, currently 27.87, GDX faces stiff call resistance at 28 & above with only moderate put support down to 25 and less below. This seems to support the H&S.

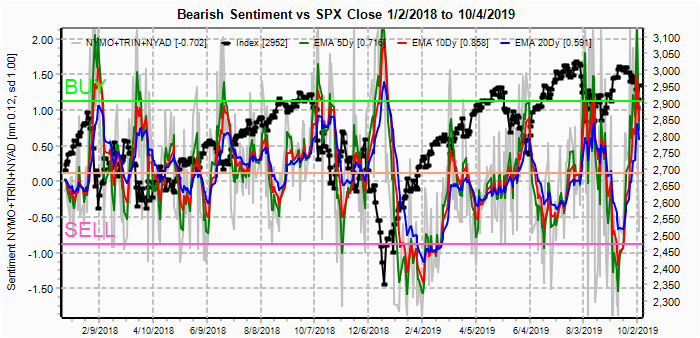
IV. Technical / Other
Last week I noticed an extreme reading in the Technical Indicator Composite (NYMO + TRIN + NYAD + NYUD), but the last time this happened was at the Dec 2018 lows so the interpretation was unclear, but the outcome last week was not. Last weeks selloff has produced an almost mirror-image reversal in sentiment that supports a test of the ATH.
Conclusions. Was last weeks performance a preview of fireworks to come or simply an exhaustion move for both bears and bulls? Sentiment indicates that disappointment may lie ahead for both sides that could result from some type of detente rather than escalation with the China trade talks. Trumps views are always a coin toss for me, but China;s recent actions to purchase more US soybeans may mean some positive progress, but likely only in baby steps. Trump's attention may start to be diverted toward EU trade and potential impeachment hearings and less toward the evil Chinese.
Weekly Trade Alert. The SPX is still likely to be headed headed higher INT term, but ST may remain in a fairly tight range 2825-2925. My view is still < 40% for a comprehensive trade deal with China, but progress can be made, if only piecemeal. Updates @mrktsignals.
Investment Diary, Indicator Primer, update 2019.04.27 Stock Buybacks, update 2018.03.28 Dumb Money/Smart Money Indicators
Article Index 2019 by Topic
Article Index 2018 by Topic
Article Index 2017 by Topic
Article Index 2016 by Topic
Long term forecasts
© 2019 SentimentSignals.blogspot.com