Saturday, December 9, 2023

Short Term Sentiment is Becoming Frothy

The biggest surprise last week was that stocks and bonds moved in the opposite direction.  The job openings (JOLTs) number Tue was weaker than expected, bringin out the recession crowd, and int rates (TNX) fell from the 4.3% level to 4.1% by Wed.  Stocks fell with the SPX dropping below the 4550 target before rebounding.  Thur both stocks and int rates rebounded and with the Fri jobs report coming out stronger than expected (by everyone else).  As bonds fell with rates back to 4.25%, stocks rallied making a new recovery high intraday at 4609, eclipsing the July high of 4607.  This will likely cause the bears to capitulate as trend followers think prices will continue higher just as sentiment is warning of a crowded long trade.  A significant pullback is expected, probably in 2024 Q1. 

The biggest changes in sentiment were in the hedge spread with a sharp decline to a weak Sell (ST) and a huge decline in DJIA (YM) futures (COT) dropping from + 2 SD to neutral and NDX (NQ) dropping to -.5 SD from neutral (SPX remains neutral).

It was almost exactly one year ago when I had a special section in Tech/Other as to why I thought the inverted yield curve as a perfect recession indicator for 2023 H2 was likely to fail and why the unemployment numbers were more important and were likely to mirror the low numbers of the late 1960s.  Last week MW ran an article about a Fed recession indicator called the Sahm Rule that is based on the unemployment numbers and this weeks Tech/Other takes a closer look.  Hint,no recession.


I. Sentiment Indicators

The INT/LT Composite indicator (outlook 3 to 6+ months) has three separate components. Starting Aug 26, 2023 SPX options are removed due to extreme 0DTE volume distortions. New weights are ETF put-call indicator (30%), SPX 2X ETF INT ratio (40%), and 3rd a volatility indicator (30%) which combines the options volatility spread of the ST SPX (VIX) to the ST VIX (VVIX) with the UVXY $ volume.

Update Alt. Bearish sentiment continues to decline with the overall LT composite at -.5 SD.

Update Alt EMA. Bearish sentiment continues to fall, but remains well short of a weak Sell. The ST Composite as a ST (1-4 week) indicator includes the NYSE volume ratio indicator (NYDNV/NYUPV & NYDNV/NYDEC) and the UVXY $ Vol/SPX Trend. Weights are 80%/20%.

Update. Bearish sentiment rose last week, but remains below neutral.

Update EMA. Bearish sentiment rose last week, but remains below neutral.
The ST VIX calls and SPXADP indicator bearish sentiment remains below the weak Sell, so continued volatility is expected.
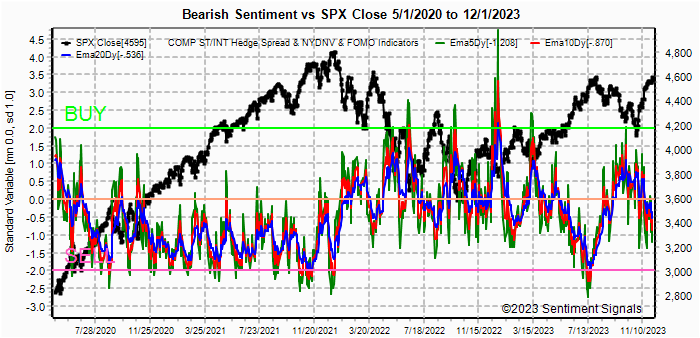
The ST/INT Composite indicator (outlook 1 to 3 months) is based on the Hedge Spread (48%) and includes ST Composite (12%) and three options FOMO indicators using SPX (12%), ETF (12%), and Equity (12%) calls compared to the NY ADV/DEC issues (inverted). FOMO is shown when strong call volume is combined with strong NY ADV/DEC. See Investment Diary addition for full discussion.

Update EMA. Bearish sentiment has fallen sharply led by a decrease in hedging, but remains well short of the July price highs.

Bonds (TNX).  Bearish sentiment remains at the strong Sell level. For the INT outlook with LT still negative, the gold miners (HUI) bearish sentiment is presented in a new format using the data mining software to add the inverse TNX rate to the ETF ratio.

Update. Bearish sentiment rose as prices dropped from 245 to about 230, but remains below neutral.


II. Dumb Money/Smart Money Indicators

This is a new hybrid option/ETF Dumb Money/Smart Money Indicator as a INT/LT term (outlook 2-6 mns) bearish sentiment indicator. The use of ETFs increases the duration (term).

Update. Bearish sentiment remains near the weak Sell level.

With the sister options Hedge Spread as a ST/INT indicator (outlook 1-3 mns), bearish sentiment fell sharply with the ST (grn) reaching the weak Sell level. A new composite SPX options indicator uses both the volume adj (1/B-A) and P/C equivalent spread (A-B) to compensate for the discrepancy between the two.  This replaces the old SPX options indicator for the SPX ETFs + options below and the INT/LT composite. No chart.

For the SPX, I am switching to hybrid 2X ETFs plus SPX options. Taking a look at the INT term composite (outlook 2 to 4 mns), bearish sentiment remains near neutral.

For the NDX combining the hybrid ETF options plus NDX 3X ETF sentiment with the interest rate effect,  (outlook 2 to 4 mns) bearish sentiment shows similar extremes between ETF and options as in late 2020 which resulted in a choppy market until options sentiment rose.  Note QQQ options are optimal, but are N/A and are included in ETF options.

Bearish sentiment continues to drop, but remains above the strong Sell level seen in July.

For the SPX combining the hybrid ETF options plus SPX 2X ETF (outlook 2 to 4 mns) produces an indicator where, in this case, ETF options are a proxy for the SPY options.

Bearish sentiment for SPX is more bullish than for NDX, but down sharply from the neutral level last week.


III. Options Open Interest

Using Thur closing OI, remember that further out time frames are more likely to change over time, and that closing prices are more likely to be effected. Delta hedging may occur as reinforcement, negative when put support is broken or positive when call resistance is exceeded.  This week I will look out thru Dec 15. A text overlay is used for extreme OI to improve readability, P/C is not changed.  A new addition is added for OI $ amounts with breakeven pts (BE) where call & put $ amounts cross.

With Fri close at SPX 4604, options OI for Mon is moderate with support/resistance around current levels, so it may be a tight range day.
Wed has somewhat smaller OI where SPX has put support a 4550 and resistance at 4600, so some downward pressure is likely.
For Fri AM strong OI with huge ITM call positions at straddles between SPX 4400 and 4550 could pressure prices as low as 4500 with negative economic surprises.
For Fri PM strong SPX OI shows strong put support at 4525 and call resistance at 4600 that likely define a possible range.

IV. Technical / Other

The Sahm Recession Indicator signals the start of a recession when the three- month moving average of the national unemployment rate (U3) rises by 0.50 percentage points or more relative to the minimum of the three-month averages from the previous 12 months.

As the chart below shows with a line at .5, the unemployment rate (UR) remains short of the .5 level.  This includes Dec 8 data with the UR at 3.7%.  As I had pointed out almost exactly a year ago when I challenged the validity of the inverted yield curve as a predictor of a recession in the current period, the UR data is much more accurate, although ST, than the yield curve.


This chart shows the Sahm Rule on a natural log scale (base e, 2.72) which cuts down the effects of the huge spike in 2020.  In this case the log(e) of .5 is -.69 and the current value is about -1.2.  This shows the start of a recession almost exactly when the Sahm Rule crosses the line and is normally several months before a recession is identified..  (Note log of negative values is undefined, log(e) of 1 is 0)

The following uses barcharts.com as a source and discusses S&P futures (ES) as a third venue of stock sentiment in addition to options and ETFs.  The non-commercial/commercial spread represents a LT bearish sentiment (dumb money/smart money) indicator. As explained in investopedia, commercial investors (red) are institutions and are smart money, while non-commercials (green) are speculators such as hedge funds and are dumb money. Here is the current  barchart graph for the S&P 500 (top) and trader positions (1st bot) with positives as net longs and negatives as net shorts.  Bearish sentiment is represented by the spread and is positive if red > green (Buy) and negative if green > red (Sell).  ES (SPX) sentiment is neutral at + .25 SD, NQ (NDX) is negative at -.5 SD, YM (DJIA) is neutral at +.25 SD, Dow theory may support DJIA thru EOY.

Click dropdown list to select from the following options:

Tech / Other History
2023

2022

Other Indicators

Conclusions.  Next weeks big economic news will be the CPI/PPI on Tue/Wed with CPI expected to be lower, but core higher, so a tossup.  Bearish sentiment is falling fast and the huge ITM call positions for Fri SPX AM exp may provide fuel for the ST pullback indicated by the VIX call indicator.  However, a larger decline is likely to be posponed until the new year.

Weekly Trade Alert..  A negative surprise is possible pushing the SPX down to 4500-50 by Fri open, but the large ITM calls are low enough to make the probability a tossup.  Updates @mrktsignals.

Investment Diary,  Indicator Primer, Tech/Other Refs,
 update 2021.07.xx  Data Mining Indicators - Update, Summer 2021,
 update 2020.02.07 Data Mining Indicators,
 update 2019.04.27 Stock Buybacks,
 update 2018.03.28 Dumb Money/Smart Money Indicators

Article Index 2019 by Topic, completed thru EOY 2020.02.04
Article Index 2018 by Topic
Article Index 2017 by Topic
Article Index 2016 by Topic

Long term forecasts

© 2023 SentimentSignals.blogspot.com

Saturday, December 2, 2023

Effects of Inflation Are Always Positive in the Beginning

Last weeks markets were stronger than expected as economic data supported the bullish view of an economy weakening just enough to encourage the Fed to be less hawkish, but not enough to threaten a recession.  Third quarter GDP came at 5.2%, but is indicated to drop to 2% in Q4, while PCE inflation also fell.  The combined outlook helped rates to fall with the TNX just above 4.25%, down from 5% in Oct.  So far since the Oct lows, the SPX has matched the gain in TLT at 12% which seems ridiculous since the TLT fell over 50% from the 2020 highs at 160 to 82.  If rates continue to fall to TNX 2.75-3%, this would mean a TLT 50% rally to 120 (Avi's target a few months ago), and for the SPX 50% from 4100 is over 6000.  Seems a little over optimistic to me.

One of the things to be concerned about compared to the late 1960-80's period is that the first bust of inflation typically has very benign results, primarily from the bond market expectations of the "return to normal", or in this case the ultra-low rates of the pandemic era.  This causes the nominal or market rate to be low compared to inflation producing unusually low "real" rates.  Even today with TNX rates at 4.25% and inflation at 3%, the "real" cost of borrowing is 1.25% compared to the pandemic era of 0% inflation and nominal "real" rates at 1%.  Another factor supporting the economy was an incredible amount of household wealth created by the ultra-low int rates in the inflation of housing prices by 50-100% in many areas of the country.  Higher current rates have done little to effect this wealth as home prices stayed higher, even with high mortgage rates.  I still think that "Goldilocks" is likely to be disappointed, and next weeks jobs report may be the first major surprise.

Last weeks call for a "cyclical" recovery in the DJIA and weakness in the NDX was timely with the DJIA up 3%, the NDX down 1% from weekly highs and SPX up 1%.  Bonds, however, remained strong.  For chart watchers, the DJIA rallied 6,000 pts off the Oct 2022 lows in 3 mns (A), before going sideways (B), and a similar rally (C) would put it 38K.  I doubt it, but not impossible if rates continue to fall.  Fri jobs report will likely determine strength seen thru the EOY, I could be wrong, but am still expecting relatively strong job growth.


I. Sentiment Indicators

The INT/LT Composite indicator (outlook 3 to 6+ months) has three separate components. Starting Aug 26, 2023 SPX options are removed due to extreme 0DTE volume distortions. New weights are ETF put-call indicator (30%), SPX 2X ETF INT ratio (40%), and 3rd a volatility indicator (30%) which combines the options volatility spread of the ST SPX (VIX) to the ST VIX (VVIX) with the UVXY $ volume.

Update Alt. Bearish sentiment retreated slightly but remains near neutral.

Update Alt EMA. Bearish sentiment retreated slightly but remains near neutral. The ST Composite as a ST (1-4 week) indicator includes the NYSE volume ratio indicator (NYDNV/NYUPV & NYDNV/NYDEC) and the UVXY $ Vol/SPX Trend. Weights are 80%/20%.

Update. Bearish sentiment rose late in the week, but remains near the weak Sell.

Update EMA. Bearish sentiment VST (grn) whipsawed from a strong Sell to neutral.
The ST VIX calls and SPXADP indicator bearish sentiment remains between a weak and strong Sell as markets showed little reaction to BF.
The ST/INT Composite indicator (outlook 1 to 3 months) is based on the Hedge Spread (48%) and includes ST Composite (12%) and three options FOMO indicators using SPX (12%), ETF (12%), and Equity (12%) calls compared to the NY ADV/DEC issues (inverted). FOMO is shown when strong call volume is combined with strong NY ADV/DEC. See Investment Diary addition for full discussion.

Update EMA. Bearish sentiment remains below neutral, but well above July price highs' level.

Bonds (TNX).  Bearish sentiment remains at the strong Sell level.  Rates continued to rise for almost a year in 2018 after the strong Buy, so timing is uncertain. For the INT outlook with LT still negative, the gold miners (HUI) bearish sentiment is presented in a new format using the data mining software to add the inverse TNX rate to the ETF ratio.

Update. Bearish sentiment fell with the ETF sentiment below neutral and combined at the weak Sell level.


II. Dumb Money/Smart Money Indicators

This is a new hybrid option/ETF Dumb Money/Smart Money Indicator as a INT/LT term (outlook 2-6 mns) bearish sentiment indicator. The use of ETFs increases the duration (term).

Update. Bearish sentiment remains around the weak Sell level and may be following a path similar to early 2021.

With the sister options Hedge Spread as a ST/INT indicator (outlook 1-3 mns), bearish sentiment remains slightly positive with the LT (blu) positive and the ST (grn) negative. A new composite SPX options indicator uses both the volume adj (1/B-A) and P/C equivalent spread (A-B) to compensate for the discrepancy between the two.  This replaces the old SPX options indicator for the SPX ETFs + options below and the INT/LT composite. No chart.

For the SPX, I am switching to hybrid 2X ETFs plus SPX options. Taking a look at the INT term composite (outlook 2 to 4 mns), bearish sentiment remains near neutral with options (0DTE) negative and ETFs positive.

For the NDX combining the hybrid ETF options plus NDX 3X ETF sentiment with the interest rate effect,  (outlook 2 to 4 mns) bearish sentiment shows similar extremes between ETF and options as in late 2020 which resulted in a choppy market until options sentiment rose.  Note QQQ options are optimal, but are N/A and are included in ETF options.

Bearish sentiment continues to decline toward the strong Sell.

For the SPX combining the hybrid ETF options plus SPX 2X ETF (outlook 2 to 4 mns) produces an indicator where, in this case, ETF options are a proxy for the SPY options.

Bearish sentiment for SPX is more bullish than NDX at neutral.


III. Options Open Interest

Using Thur closing OI, remember that further out time frames are more likely to change over time, and that closing prices are more likely to be effected. Delta hedging may occur as reinforcement, negative when put support is broken or positive when call resistance is exceeded.  This week I will look out thru Dec 8. A text overlay is used for extreme OI to improve readability, P/C is not changed.  A new addition is added for OI $ amounts with breakeven pts (BE) where call & put $ amounts cross.

With Fri close at SPX 4595, options OI for Mon is moderate with put support at 4550 and call resistance over 4575.  An early move over 4600 will likely reverse by the close.
Wed has somewhat smaller OI where SPX again has put resistance over 4575 with smaller put support.
For Fri moderate SPX OI shows a lot of optimism with strong call resistance at 4575 and 4600.  Could see prices fall to 4550 or lower.
For Fri optn exp strong SPX OI again shows call resistance over 4550 with put support at 4525..


IV. Technical / Other


The following uses barcharts.com as a source and discusses S&P futures (ES) as a third venue of stock sentiment in addition to options and ETFs.  The non-commercial/commercial spread represents a LT bearish sentiment (dumb money/smart money) indicator. As explained in investopedia, commercial investors (red) are institutions and are smart money, while non-commercials (green) are speculators such as hedge funds and are dumb money. Here is the current  barchart graph for the S&P 500 (top) and trader positions (1st bot) with positives as net longs and negatives as net shorts.  Bearish sentiment is represented by the spread and is positive if red > green (Buy) and negative if green > red (Sell).  ES (SPX) sentiment is neutral at + .25 SD, NQ (NDX) is negative at -.5 SD, YM (DJIA) is a strong Buy at +2 SD, Dow theory may support DJIA thru EOY.

Click dropdown list to select from the following options:

Tech / Other History
2023

2022

Other Indicators

Conclusions.  Chart wise, everything looks a lot like the rally off the Oct 2022 lows, but sentiment (ex DJIA futures) tells a different story with INT sentiment neutral at best.  Everything will likely depend on the bond market and if rates continue to fall, stocks will rally.

Weekly Trade Alert.  Fri SPX options OI shows way too much optimism for support from the jobs report (weak to support dovish Fed), and a surprise (stronger than expt) likely means a pullback to SPX 4550 or lower.  Updates @mrktsignals.

Investment Diary,  Indicator Primer, Tech/Other Refs,
 update 2021.07.xx  Data Mining Indicators - Update, Summer 2021,
 update 2020.02.07 Data Mining Indicators,
 update 2019.04.27 Stock Buybacks,
 update 2018.03.28 Dumb Money/Smart Money Indicators

Article Index 2019 by Topic, completed thru EOY 2020.02.04
Article Index 2018 by Topic
Article Index 2017 by Topic
Article Index 2016 by Topic

Long term forecasts

© 2023 SentimentSignals.blogspot.com

Saturday, November 25, 2023

What Happened to the Inverted Yield Curve Recession?

Last week was a good week for a vacation as the only significant action was Mon AM's move to SPX 4550 with the rest of the week closings only about 10 pis above or below.  The gap fill at 4600 (act 4580) is only a few pts away and may be reached before any pullback.  Bearish sentiment remains mostly unchanged so an INT/LT top is not expected.  Fri economic release of the Nov "flash" PMIs did show strength as mentioned last week's outlook for a cyclical recovery with services (70% GDP) strong while manufacturing (15% GDP) was weak.  As a result the DJIA was up and NDX was down with higher TNX rates, and the SPX up slightly.  A recovery coud lead to a trading range of several hundred pts thru mid 2024, perhaps SPX 4250-4650.

Economic data for the week includes  Q3 GDP 1st release and is expected at a 4.9% growth rate and Thur OCT PCE inflation that is expected to moderate.  NFP is the following Fri.


I. Sentiment Indicators

The INT/LT Composite indicator (outlook 3 to 6+ months) has three separate components. Starting Aug 26, 2023 SPX options are removed due to extreme 0DTE volume distortions. New weights are ETF put-call indicator (30%), SPX 2X ETF INT ratio (40%), and 3rd a volatility indicator (30%) which combines the options volatility spread of the ST SPX (VIX) to the ST VIX (VVIX) with the UVXY $ volume.

Update Alt. Bearish sentiment Is just below neutral with volatility measures the weakest and SPX ETFs the strongest.

Update Alt EMA. Bearish sentiment remains near neutral. The ST Composite as a ST (1-4 week) indicator includes the NYSE volume ratio indicator (NYDNV/NYUPV & NYDNV/NYDEC) and the UVXY $ Vol/SPX Trend. Weights are 80%/20%.

Update. Bearish sentiment has reached the weak Sell level and now supports the bearish outlook of the VIX & SPXADP indicator.

Update EMA. Bearish sentiment is increasing, but not enough to warrant more than a 2-3% pullback.
The ST VIX calls and SPXADP indicator bearish sentiment took a nosedive last week and is nearing a srong Sell.
The ST/INT Composite indicator (outlook 1 to 3 months) is based on the Hedge Spread (48%) and includes ST Composite (12%) and three options FOMO indicators using SPX (12%), ETF (12%), and Equity (12%) calls compared to the NY ADV/DEC issues (inverted). FOMO is shown when strong call volume is combined with strong NY ADV/DEC. See Investment Diary addition for full discussion.

Update EMA. Bearish sentiment reversed last weeks weak Sell level, any pullback should only be ST.

Bonds (TNX).  Bearish sentiment continues lower at the strong Sell level. For the INT outlook with LT still negative, the gold miners (HUI) bearish sentiment is presented in a new format using the data mining software to add the inverse TNX rate to the ETF ratio.

Update. Bearish sentiment continues to fall sharply, now with the ETFs at neutral, probably due to hopes of Fed easing.


II. Dumb Money/Smart Money Indicators

This is a new hybrid option/ETF Dumb Money/Smart Money Indicator as a INT/LT term (outlook 2-6 mns) bearish sentiment indicator. The use of ETFs increases the duration (term).

Update. Bearish sentiment fell sharply and continues to resemble early 2021.

With the sister options Hedge Spread as a ST/INT indicator (outlook 1-3 mns), bearish sentiment joined the ST indicators at the weak Sell level. A new composite SPX options indicator uses both the volume adj (1/B-A) and P/C equivalent spread (A-B) to compensate for the discrepancy between the two.  This replaces the old SPX options indicator for the SPX ETFs + options below and the INT/LT composite. No chart.
For the SPX, I am switching to hybrid 2X ETFs plus SPX options. Taking a look at the INT term composite (outlook 2 to 4 mns), bearish sentiment dipped below neutral.
For the NDX combining the hybrid ETF options plus NDX 3X ETF sentiment with the interest rate effect,  (outlook 2 to 4 mns) bearish sentiment shows similar extremes between ETF and options as in late 2020 which resulted in a choppy market until options sentiment rose.  Note QQQ options are optimal, but are N/A and are included in ETF options.

Bearish sentiment continues to decline below the weak Sell level with weakness from both NDX ETFs and ETF options.

For the SPX combining the hybrid ETF options plus SPX 2X ETF (outlook 2 to 4 mns) produces an indicator where, in this case, ETF options are a proxy for the SPY options.

Bearish sentiment for SPX is more bullish than for NDX.


III. Options Open Interest

Using Thur closing OI, remember that further out time frames are more likely to change over time, and that closing prices are more likely to be effected. Delta hedging may occur as reinforcement, negative when put support is broken or positive when call resistance is exceeded.  This week I will look out thru Dec 1. A text overlay is used for extreme OI to improve readability, P/C is not changed.  A new addition is added for OI $ amounts with breakeven pts (BE) where call & put $ amounts cross.

With Fri close at SPX 4559, options OI for Mon is moderate with put support starting at 4525 and only minor call resistance above 4550.  ITM calls could be a negative, and some pullback is possible.
Wed has very small OI where SPX has support between 4500 and 4550.
For Thur EOM strong SPX OI shows stronger resistance from 4550-4600 and the straddle at 4500 looks like a likely target.

For Fri put support is somewhat stronger and may keep prices over SPX 4500 .

IV. Technical / Other

The following uses barcharts.com as a source and discusses S&P futures (ES) as a third venue of stock sentiment in addition to options and ETFs.  The non-commercial/commercial spread represents a LT bearish sentiment (dumb money/smart money) indicator. As explained in investopedia, commercial investors (red) are institutions and are smart money, while non-commercials (green) are speculators such as hedge funds and are dumb money. Here is the current  barchart graph for the S&P 500 (top) and trader positions (1st bot) with positives as net longs and negatives as net shorts.  Bearish sentiment is represented by the spread and is positive if red > green (Buy) and negative if green > red (Sell).  ES (SPX) sentiment is neutral at + .25 SD, NQ (NDX) is Neuttral at +0 SD, YM (DJIA) is a strong Buy at +2.5 SD, Dow theory may support DJIA thru EOY.

Click dropdown list to select from the following options:

Tech / Other History
2023

2022

Other Indicators

Conclusions.  ST sentiment continues to support a pullback of 2-3% (SPX 4400-4450) but the Aug gap at 4580 may need to be filled first.  VST BF sales will probably determine which target is met first.

Weekly Trade Alert.  SPX options OI shows Mon as the most likely time for a final thrust higher, while Wed-Thur look like the best time for a ST pullback..  Updates @mrktsignals.

Investment Diary,  Indicator Primer, Tech/Other Refs,
 update 2021.07.xx  Data Mining Indicators - Update, Summer 2021,
 update 2020.02.07 Data Mining Indicators,
 update 2019.04.27 Stock Buybacks,
 update 2018.03.28 Dumb Money/Smart Money Indicators

Article Index 2019 by Topic, completed thru EOY 2020.02.04
Article Index 2018 by Topic
Article Index 2017 by Topic
Article Index 2016 by Topic

Long term forecasts

© 2023 SentimentSignals.blogspot.com