
Jim Cramer of CNBC has been using a timing cycle chart from Larry Williams to predict a correction starting July 27. Several sentiment indicators, including the VIX term structure (VXV/VIX), seem to support this as discussed in the Tech/Other section. Looking at the 2019 rally off the Dec 2018 lows, each of three 5-10% corrections were preceded by the VXv/VIX reaching 1.2 shortly before the correction began.
I. Sentiment Indicators
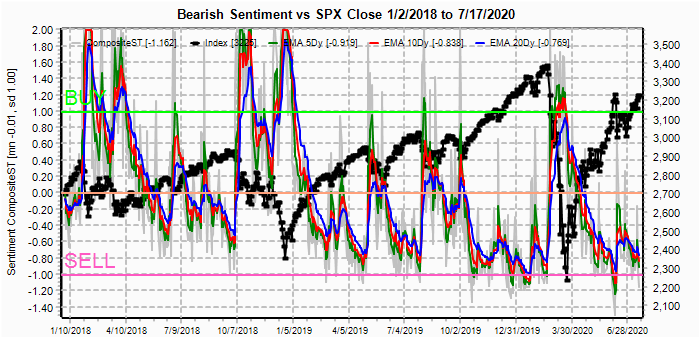
The overall Indicator Scoreboard (INT term, outlook two to four months) bearish sentiment is modestly lower than last week, but a decline down to the early June level is likely needed to get a larger decline.

The INT view of the Short Term Indicator (VXX $ volume and Smart Beta P/C [ETF Puts/Equity Calls], outlook two to four months) bearish sentiment saw a modest bounce on the Mon-Tue decline then reversed to unchanged.
Bonds (TNX). Bearish sentiment on bonds is nearing zero. As discussed by B of A, is the recent run up in rates in China a harbinger for what is to come for US rates?

For the INT outlook with LT still negative, the gold miners (HUI) bearish sentiment remains near lows as HUI price consolidates near highs. Inverse movement to int rates is still expected.

II. Dumb Money/Smart Money Indicators
The option-based Dumb Money/Smart Money Indicator as short/INT term (outlook 2 to 4 mns/weeks) a brief pop in bearish sentiment returned to almost unchanged by Fri. A drop down to the levels seen early June is expected.

And the sister options Hedge Ratio bearish sentiment saw an even sharper pop on the early week's decline that probably explains the sharp rebound.

III. Options Open Interest
Using Thur closing OI, remember that further out time frames are more likely to change over time, and that closing prices are more likely to be effected. Delta hedging may occur as reinforcement, negative when put support is broken or positive when call resistance is exceeded. This week I will look out thru July 24 plus EOM for the SPX. Also, this week includes a look at the TLT for Aug exp.
With Fri close at SPX 3225, options OI for Mon shows call resistance starting at 3225 with put support starting at 3200. Some weakness is possible early in the day, but there may be news about covid vaccines over the W/E that push prices in either direction.

Wed has somewhat larger OI where SPX shows strong resistance at 3225 although put support is stronger up to 3200. Backing and filling (trading range) seems most likely.

For Fri, large OI may influence weekly behavior and SPX OI shows call resistance could push prices down to the 3150 area.

For the EOM July 31, large put positions show support up to 3200 while call resistance begins at 3225. My feeling is that a top similar to last Mon may occur sometime over the next two weeks where we see a strong open (SPX 3240+) that reverses then continues down for the start of a larger correction.

Currently the TLT is 167 with the TNX at 0.63%. TLT is facing strong call resistance over 167 with little put support below current levels, but it is difficult to see a strong reversal while the Fed is controlling rates.

IV. Technical / Other
First, I want to clarify the reasoning for using some of the data mining tools for analyzing the Equity P/C. The chart below shows the volume of equity puts and calls over time. One of the reasons the Equity P/C is so low currently is the very low volume of put buying (red) and tends to have little value as a measure of sentiment, while high call buying as a measure of a high degree of speculation is a clear warning of an important top. Currently the 10 day SMA is at 1.5M, about the same as Sept 2018, and about 200k below Jan&Feb 2020.

As discussed in the intro the VIX term structure is a measure of ST/INT volatility and when the INT VIX falls compared the the ST VXV this generates a measure of complacency. In the past a level of about 1.2 has been an important level that acts as a necessary, but not sufficient condition, for most 5%+ corrections. More important (INT) tops tend to show longer periods of complacency. Looking at the 2019 rally off the Dec 2018 lows, each of three 5-10% corrections (red) were preceded by the VXv/VIX reaching 1.2 shortly before the correction began.

Finally, a look at my original Dumb/Smart Money options indicator (CPCI/CPC) where high values are a SELL and low a BUY. The significance is the breakout over the 8 year range of 1 to 1.3. The series starts in late 2005, and the last two times the values were this high were mid-2007 and mid-2010. Does this mean a longer term bear market is around the corner?

Conclusions. Trader Joe's outlook may be the best outlook which is w5 of an EW B wave, but sentiment indicates that a 5-10% correction may still be a week or two away. Higher prices last week ignored SPX OI call resistance so I am not sure if it will contain prices, but more consolidation between 3200 and 3225 seems likely with a possible late week pullback to 3150 unless more put support is added. A ST breakout to 3240-50 is likely over the next two weeks before a larger correction.
Weekly Trade Alert. None. Updates @mrktsignals.
Investment Diary, Indicator Primer,
update 2020.02.07 Data Mining Indicators,
update 2019.04.27 Stock Buybacks,
update 2018.03.28 Dumb Money/Smart Money Indicators
Article Index 2019 by Topic, completed thru EOY 2020.02.04
Article Index 2018 by Topic
Article Index 2017 by Topic
Article Index 2016 by Topic
Long term forecasts
© 2020 SentimentSignals.blogspot.com
No comments:
Post a Comment