
For the INT term another important indicator, the SKEW, has joined the Equity P/C as an early warning of a potential turn. Last discussed early June, both indicators showed spikes 1-4 months before the INT tops of Jan & Oct 2018 and Feb 2020, but after blow off tops of SPX gains of 5-7% before the decline began. See the Tech/Other section of an update.
I. Sentiment Indicators
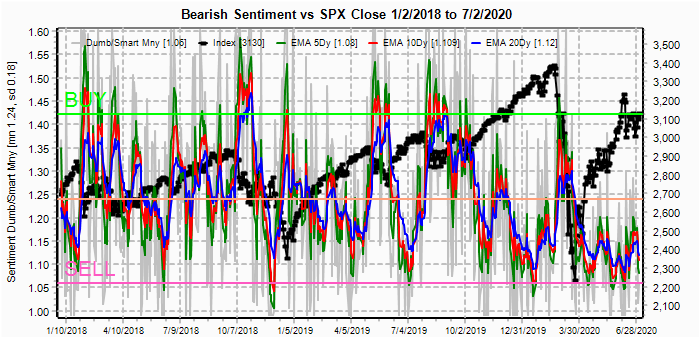
The overall Indicator Scoreboard (INT term, outlook two to four months) bearish sentiment remains in a narrow range similar to Aug 2018 and Feb 2020.

The INT view of the Short Term Indicator (VXX $ volume and Smart Beta P/C [ETF Puts/Equity Calls], outlook two to four months) bearish sentiment remains in a narrow range as well.

Bonds (TNX). Bearish sentiment for bonds continues to push lower although there are some indications of rising inflation, especially at the grocery store.

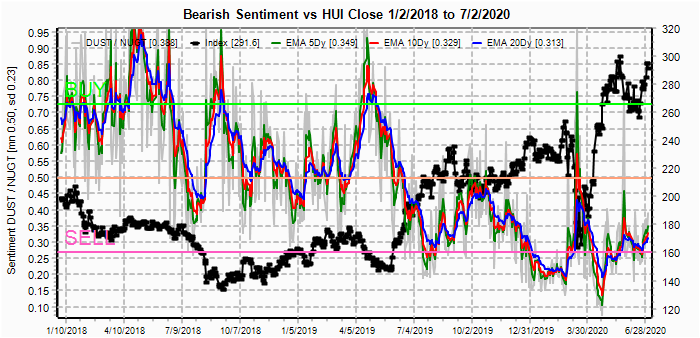
For the INT outlook with LT still negative, the gold miners (HUI) bearish sentiment remains very low.
II. Dumb Money/Smart Money Indicators
The option-based Dumb Money/Smart Money Indicator as short/INT term (outlook 2 to 4 mns/weeks) bearish sentiment moved down sharply last week, but not near recent extremes yet.
And the sister options Hedge Ratio sentiment also turned down sharply near the lows seen previously in 2020 that may mean some downward momentum is possible.

III. Options Open Interest
Using Thur closing OI, remember that further out time frames are more likely to change over time, and that closing prices are more likely to be effected. Delta hedging may occur as negative reinforcement when put support is broken or call resistance is exceeded. This week I will look out thru July 10. Also, this week includes a look at the TLT for July exp.
With Fri close at SPX 3130, options OI for Mon shows fairly large put support at 3050 and call resistance at 3150. In between, calls currently show negative bias down to 3100, but the puts at 3135 are likely to cause any early weakness to be reversed by the close.

Wed has small OI where SPX where anything between SPX 3000 and 3200 is possible, but a probable close is likely between 3075 and 3125.

For Fri, moderate OI are mostly hedged between SPX 3050 and 3150 and added positions during the week will likely clarify, but the 3075 to 3125 seems most likely.

Using the GDX as a gold miner proxy closing at.36.1 moved up $1 for the week and remains in a strong call resistance range.
Currently the TLT is 163.6 with the TNX at 0.67% and was up about a pt for the week. 161 to 164 seems like a probable range.

IV. Technical / Other
Several bloggers have noted the recent rise in the SKEW and have interpreted this as an imminent decline warning, but looking at the SKEW since late 2017, the cycle highs in the SKEW preceeded the SPX top by several months and about 200 pts. For instance, in late 2019 the SKEW peaked in late Dec with the SPX at 3200, while the SPX peak in Feb was 3390.

In early June, I showed the spike low for the Equity P/C and its spread to the SKEW using the data mining stdvar spread. With the Equity P/C in green and the SKEW in red, the SKEW saw extreme highs and the Equity P/C extreme lows before each of the last three INT tops, but with different lead times. Jan 2018 and Feb 2020 saw the SKEW peak before the Equity P/C low, while today's readings appear more like Oct 2018 where the Equity P/C low preceeded the SKEW high by a couple of months.

Conclusions. The longer term outlook of a trading range for SPX between 2980-3180 is largely unchanged other than being near the top of the range. A retest ot the lower portion of the range due to earnings season starting the next two weeks is possible and may be a setup for a post-stimulus ramp later in July to test the June highs.
Weekly Trade Alert. Options OI is indicating a likely range for the week of SPX 3075-3150 with a slight negative bias to Fri close of 3130. Updates @mrktsignals.
Investment Diary, Indicator Primer,
update 2020.02.07 Data Mining Indicators,
update 2019.04.27 Stock Buybacks,
update 2018.03.28 Dumb Money/Smart Money Indicators
Article Index 2019 by Topic, completed thru EOY 2020.02.04
Article Index 2018 by Topic
Article Index 2017 by Topic
Article Index 2016 by Topic
Long term forecasts
© 2020 SentimentSignals.blogspot.com
No comments:
Post a Comment