
Many of the sentiment indicators are showing signs of capitulation with ETFs discussed in the Dumb/Smart Money section and several data mining indicators covered in the Tech/Other section. The extreme volatility in March still has sufficient following in the volatility products (VXX $ volume) to suggest a final rally is still in store, however. Supporting this idea are Tom DeMark, who last week at ZH discussed the possibility of a top being in already for the NDX, while the SPX was given a target near 3500 over the next few weeks. OnTheMoneyUK last week also had a write up of the stock market cycle in election years which showed an expected rally thru Aug-Sept after March lows.
I. Sentiment Indicators
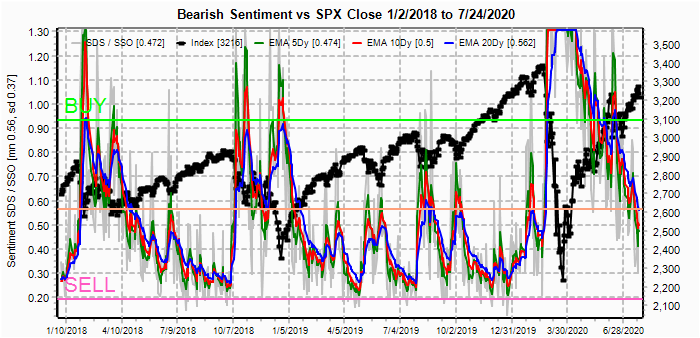
The overall Indicator Scoreboard (INT term, outlook two to four months) bearish sentiment fell sharply last week with the ST (grn) reaching a SELL similar to June 2018 and Aug 2019.

The INT view of the Short Term Indicator (VXX $ volume and Smart Beta P/C [ETF Puts/Equity Calls], outlook two to four months) bearish sentiment is lagging primarily due to strength in the VXX $ volume shown below.

A closer lookup at the VXX $ volume shows an interesting pattern, which is overall declining bearish sentiment, probably due to the increasingly sharp rallies resulting from larger Fed reactions from market declines. But the end result is even larger "busts" due to the decreasing bearish sentiment. The boxed areas in June 2018 and Aug 2019 saw similar sentiment where declines of 3% and 7% were followed by blow offs of more than double the decline. Now, an SPX 200 pt decline to 3100 would imply a blow off to about 3500.

Bonds (TNX). Still consolidating pre-election.

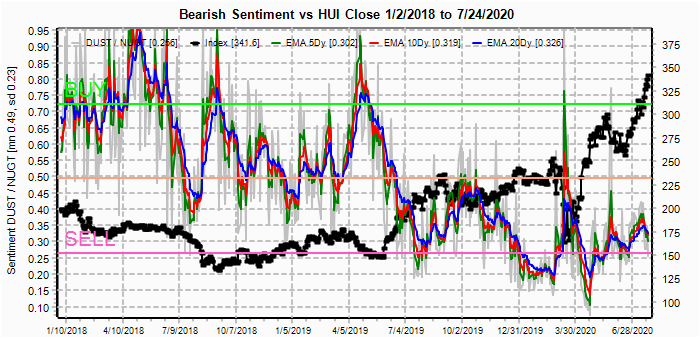
For the INT outlook with LT still negative, the gold miners (HUI) bearish sentiment is non-existent, so still waiting to see what happens to rates.
II. Dumb Money/Smart Money Indicators
The option-based Dumb Money/Smart Money Indicator as short/INT term (outlook 2 to 4 mns/weeks) has almost reached the level prior to the June swoon.

And the sister options Hedge Ratio sentiment is finally showing capitulation, almost matching that seen at the Jan 2020 highs.

With the recent fallout in the NDX, I decided to take a look at the SPX and NDX ETFs.
The INT term NDX Long Term (2x/DM) ETFs (outlook two to four weeks) bearish sentiment remains surprisingly high, even with the out performance of the NDX, and indicates that outside the momentum FANMGs, technology is still likely to out perform.

The INT term SPX Long Term (2x/DM) ETFs (outlook two to four weeks) bearish sentiment has declined almost as fast as the SPX as risen over the past four months, and likely will reach a SELL similar to Oct 2018 over the next two months.
The Risk Aversion/Risk Preference Indicator (SPX 2x ETF sentiment/NDX ETF sentiment, outlook 2 to 4 mns/wks) as a INT indicator (pref to less risky SPX is bullish), has declined very sharply as a preference to higher risk NDX has created a similar environment as Sept-Oct 2018.

III. Options Open Interest
Using Thur closing OI, remember that further out time frames are more likely to change over time, and that closing prices are more likely to be effected. Delta hedging may occur as reinforcement, negative when put support is broken or positive when call resistance is exceeded. This week I will look out thru July 31. Also, this week includes a look at the GDX for Aug exp.
With Fri close at SPX 3216, options OI for Mon are moderate where larger call positions at 3200 may result in a weak open but likely puts at 3215 and 3230 will cause a reverse to positive by the close. The down move Fri probably increased put support.
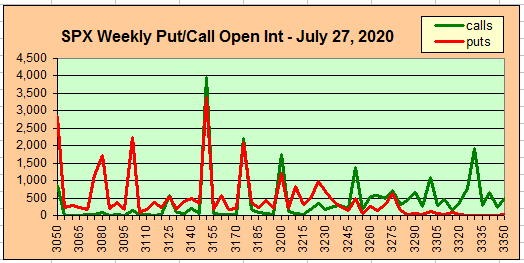
Wed has somewhat larger OI where SPX has weaker call resistance and moderate put support at 3175. Depending on Mon/Tue action, if the SPX can not make it over 3225 a range of 3175-3200 is likely for the close, but if prices make it over 3225 the put support may push prices to the 3250-75 range.

For Fri EOM, large OI may influence weekly behavior and shows much stronger call resistance starting at 3225 and up, where strong put support will likely keep the close over 3200. A srong move up mid-week for the FOMC will likely reverse by EOW.

Using the GDX as a gold miner proxy closing at 41.8 .
Currently the TLT is 169.7 with the TNX at 0.59%. The TLT remains sandwiched between large call positions at 167 and 170.
IV. Technical / Other
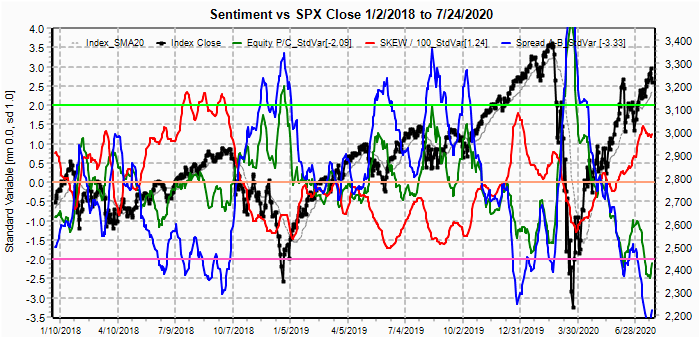
Looking a the Equity P/C to SKEW spread, sentiment continues to follow the July-Oct 2018 pattern, although with more extreme readings. The 10 day SMA for the equity calls has risen to 1.55M, higher than the 1.5M in Oct 2018, but lower than the 1.7M Feb 2020. The long term pattern since Jan 2018 suggests an even larger decline than Mar 2020 is possible, but the correction is likely to be more complex, ie similar to Oct-Dec 2018.
The SPX hedge spread (SPX puts to ETF calls) has fallen sharply from the early July period, indicating options OI put support may be weaker than normally expected.

The Crash Indicator which has been mildly supportive of SPX prices has also taken a sharp turn lower, indicating an SPX 200+ drop similar to May and Jul-Aug 2019 is possible.

Conclusions. Sentiment indicators are starting to show that the stock market is nearing the end of the "everything is great" rally, just ignore the dead bodies. A longer trend is also apparent where each of the three INT declines since Jan 2018 of 10%+, 20%+, and 30%+ were each followed by more extreme rallies induced by more extreme measures by the Fed that resulted by more extreme (low) bearish sentiment. Will the next decline be 40%+ followed by monthly stimulus checks of $2400?
Given the crashes of Feb 2018 and Mar 2020 were in alternation with the more complex decline of Oct-Dec 2020, the next decline with likely be one of several months following a top probably in Sept.
Weekly Trade Alert. A high is likely Wed/Thur that may test the 3180 area or higher, only to be followed by a sharper decline of about 200 SPX pts by mid-Aug. Updates @mrktsignals.
Investment Diary, Indicator Primer,
update 2020.02.07 Data Mining Indicators,
update 2019.04.27 Stock Buybacks,
update 2018.03.28 Dumb Money/Smart Money Indicators
Article Index 2019 by Topic, completed thru EOY 2020.02.04
Article Index 2018 by Topic
Article Index 2017 by Topic
Article Index 2016 by Topic
Long term forecasts
© 2020 SentimentSignals.blogspot.com
Your analysis is bang on. Expecting new high on s&p by november and then crash till next year. Thanks
ReplyDelete