
Vertigo is a sensation of feeling off balance, or that the world around you is spinning. This seemed like an apt description of the stock market last week as the SPX seemed to gyrate between a high of 3270-80 and a low of 3200. My timing was off, however, as I expected a high Wed/Thur and a selloff Fri to 3200 and the SPX actually rose thru Wed to 3260, dropped Thur AM to 3200 then closed the week at 3270. A ST top remains unresolved. however, as I had been expecting the SPX 3290-3300 area before a correction to 3100.
Two main drivers to the upside were large cap tech stocks, especially AAPL which rose 10% Fri, and expectations of passage of a new stimulus package, expected late Fri or over the weekend. The major "hangup" of the stimulus passage seems to be the GOPs resistance to paying unemployed workers more money to sit at home and watch Netflix rather than to return to work, while the Dems prefer to pretend that money grows on trees.
Sentiment indicators continue to warn that a 5-10% correction, about 200 SPX pts, can occur at any time while an INt top is probably due late Sept.
I. Sentiment Indicators
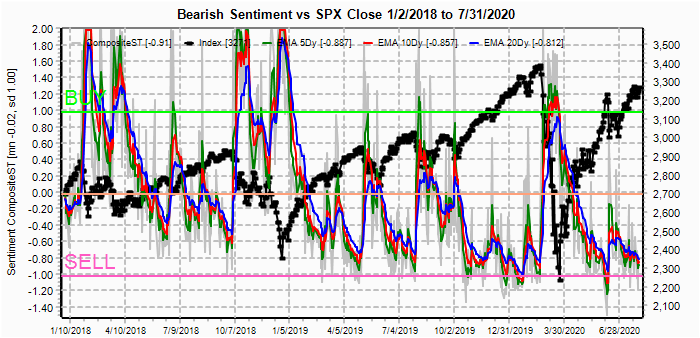
The overall Indicator Scoreboard (INT term, outlook two to four months) bearish sentiment as reached an extreme low equaling late Apr 2019, about two weeks before the May swoon. The only lower reading was Jan 2020.

The INT view of the Short Term Indicator (VXX $ volume and Smart Beta P/C [ETF Puts/Equity Calls], outlook two to four months) bearish sentiment has NOT reached an extreme low, mainly due to the VXX $ Vol, supporting the correction then blow off scenario..

Bonds (TNX). Bond sentiment remains extremely low as do interest rates.

For the INT outlook with LT still negative, the gold miners (HUI) bearish sentiment remains extremely low as prices go parabolic.

II. Dumb Money/Smart Money Indicators
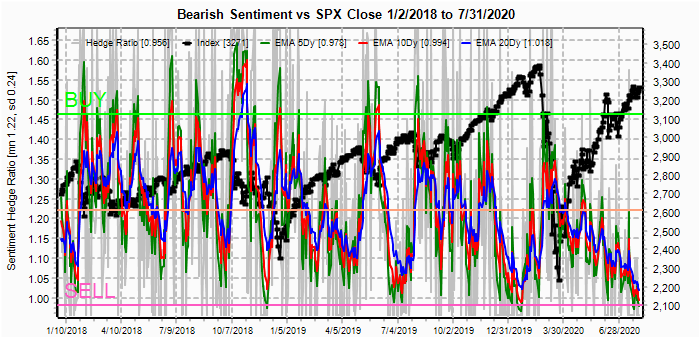
The option-based Dumb Money/Smart Money Indicator as short/INT term (outlook 2 to 4 mns/weeks) bearish sentiment has now moved marginally lower than just before the 2020 June swoon - the lowest of the last three years.


And the sister options Hedge Ratio bearish sentiment has also matched the lowest of the last three years - Jan 2020.
III. Options Open Interest
Using Thur closing OI, remember that further out time frames are more likely to change over time, and that closing prices are more likely to be effected. Delta hedging may occur as reinforcement, negative when put support is broken or positive when call resistance is exceeded. This week I will look out thru Aug 7. Last week while including extra charts for ETFs, I overlooked GDX and TLT so this week includes both for Aug exp.
Using Thur closing OI, remember that further out time frames are more likely to change over time, and that closing prices are more likely to be effected. Delta hedging may occur as reinforcement, negative when put support is broken or positive when call resistance is exceeded. This week I will look out thru Aug 7. Last week while including extra charts for ETFs, I overlooked GDX and TLT so this week includes both for Aug exp.
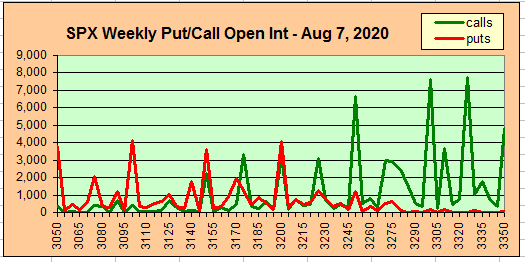
With Fri close at SPX 3271, options OI for Mon shows moderate call resistance at 3275 and above on Fri update I expected a close near 3225 that was off due to a last hour 50 pt rally, apparently based on hope of a stimulus compromise over the weekend, but a move over puts at 3250 has converted them to support.

Wed has smaller OI as call resistance over SPX 3200, so a stimulus compromise early in the week could easily move over 3300.

For Fri, large OI, especially call resistance over SPX 3250 puts the SPX in the same position as last week where a last hurrah to SPX 3300 or higher could swiftly reverse with 3225 or lower likely by Fri close.
Using the GDX as a gold miner proxy closing at 42.9 has cleared the hihest call resistance/now positive delta hedging, but prone to sharp reversals.

Currently the TLT is 171 with the TNX at 0.54% has also cleared its largest call resistance.

Looking thru other data mining indicators, I found one other that continues to support higher prices, similar to the VXX $ Vol - equity puts. As I have discussed before equity options buyers tend to be the "smart money" as seen in the run up in calls prior to recent blow off rallies, but the buying of puts has also seen a sharp run up prior to INT declines (with some false positives) with a 10 day SMA of about 750K Jan 2018, 850K Sept 2018 and 900K Jan & Feb 2020. Now at 700K higher levels are likely before an INT top.

Conclusions. Similar to last week, most sentiment indicators are showing that an INT top is approaching over the next few weeks, but there also an indication that a blow off top as seen in Jan 2018, Aug-Sept 2018 and Jan-Feb 2020 is likely before a sharp downturn. Most likel there will be a correction by mid-Aug to about SPX 3100 prior to the final blow off, targeting SPX 3500+/-.
Weekly Trade Alert. A partial compromise on the current stimulus program early in the week may push the SPX to 3300 or higher, but this could be the last hurrah before a correction thru mid-Aug to SPX 3100. Updates @mrktsignals.
Investment Diary, Indicator Primer,
update 2020.02.07 Data Mining Indicators,
update 2019.04.27 Stock Buybacks,
update 2018.03.28 Dumb Money/Smart Money Indicators
Article Index 2019 by Topic, completed thru EOY 2020.02.04
Article Index 2018 by Topic
Article Index 2017 by Topic
Article Index 2016 by Topic
Long term forecasts
© 2020 SentimentSignals.blogspot.com
Love your updates Arthur. I'm looking for that pullback to reach about 305 on the SPY, which is 3050 on the SPX, and then the blow off top into late September or early October to reach 3600 SPX. We are pretty much on the same page with small differences in targets.
ReplyDeleteAfter the blow off top I'm looking for 30-40% drop, with a downside target of 240 on the SPY (2400 SPX). It could happen all in one month going into the election, not sure? If so though then I'm looking for another huge rally back up to start after a Trump victory.
While most are calling for a depression I expect 2021 to be super bullish with 4000+ likely. Right or wrong, I'll play whatever is given to me, but currently that what I see. Thanks as always.