Two weeks ago, I discussed the possibility of Wall Street signaling support for the GOP by showing weakness during the DNC and strength during the RNC with a breakout over SPX 3400. As it turned out the markets were mostly flat for the DNC, while my personal impression was that it looked like a "womens Lib" convention where the main message was that Trump was a "bad man", so vote for us. The RNC was pretty much the standard GOP propaganda with "everything is great, the US has the strongest economy in the world, and Trump is the greatest president ever", and Wall Street cheered with the SPX soaring over 100 pts. While the Dems are more focused on defunding the police, the GOP wants to defund Social Security by eliminating the payroll tax. As Orwell says in 1984, if politicians repeat the same lie enough times the people will start believing it.
For the most part sentiment measures were unchanged for week, where you would expect more euphoria on a breakout to new highs. Options indicators did show an increase in bullishness, while ETF indicators (SPX and NDX 2x) were unchanged, and volatility indicators (VXX $ vol, and VIX) showed increased bearisness. A look at two volatility measures, the SKEW and VIX, term structure are discussed in the Tech/Other section.
Overall, sentiment seems to be most similar to Dec 2019, where further advances (possibly SPX 3600) is followed by the 3 to 6% pullback I was looking for a few weeks ago, then a final blow off for an INT top. The timing for the INT top is starting to look closer to the Nov election that could start as a "sell the news" if Trump wins after the strong gains in polls last week, or as a disappointment if Biden wins.
I. Sentiment Indicators
The overall Indicator Scoreboard (INT term, outlook two to four months) bearish sentiment made a new low last week before turning up, resembling Dec 2019.
The INT view of the Short Term Indicator (VXX $ volume and Smart Beta P/C [ETF Puts/Equity Calls], outlook two to four months) bearish sentiment is also testing its lows, but last week's spike in the VXX $ vol is ST bullish.
Bonds (TNX). Bearish sentiment in bonds remains near recent lows as do int rates.
For the INT outlook with LT still negative, the gold miners (HUI) bearish sentiment turned down as prices stabilized with the weak US$ offsetting the negative effects of higher int rates on gold.
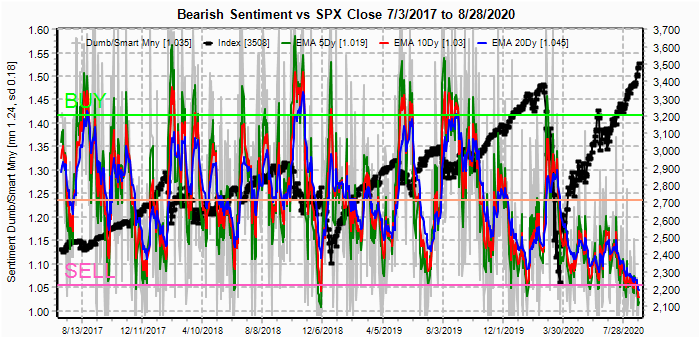
II. Dumb Money/Smart Money Indicators
The option-based Dumb Money/Smart Money Indicator as short/INT term (outlook 2 to 4 mns/weeks) bearish sentiment saw a sharp drop last week that may be warning of a ST pullback.
And the sister options Hedge Ratio sentiment remains at the lowest levels of the last three years.
III. Options Open Interest
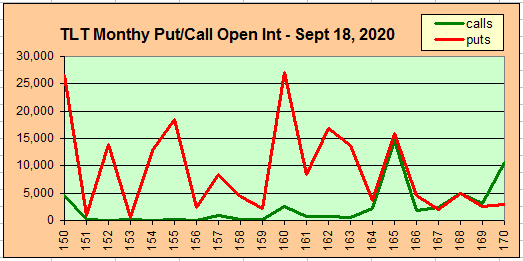
Using Thur closing OI, remember that further out time frames are more likely to change over time, and that closing prices are more likely to be effected. Delta hedging may occur as reinforcement, negative when put support is broken or positive when call resistance is exceeded. This week I will look out thru Sept 4. Also, this week includes a look at the TLT for Sept exp.
With Fri close at SPX 3508, options OI for Mon EOM sows put support below 3470, and as long as prices remain over call resistance at 3500 next resistance is 3525 and 3550.
Wed has smaller OI where SPX could see a reversal if it drops below 3525 toward 3450, but over 3525 there is little call resistance to stop a rally.
For Fri (jobs report), where large OI may influence weekly behavior, much like Wed call resistance extends downward to 3425 and may pressure prices downward depending on put rollover during the week.
For Fri, using the QQQ as a NDX (1/41) proxy closing at 292.5 (12k), a move over 295 (12.1k) faces little resistance to higher prices with major support at 286 (11,750).
Using the GDX as a gold miner proxy closing at 42, prices remain over major call resistance at 40.
Currently the TLT is 161.1 with the TNX at 0.73%. Surprisingly, sentiment shows strong put support at current levels and lower that should pressure prices higher and int rates lower. Possibly with the Fed's stance on inflation, everyone is betting on higher rates, but the contrarian view is that the economy is weaker than expected and that may mean lower rates.
IV. Technical / Other
As discussed in the Tue update, the rise in the SKEW to 145+ has happened 4 times (before now) the last 3 years and all, except Mar 2018, resulted in higher prices for the next two to three months. The high SKEW usually is a result of increased demand for OTM puts as a measure of high bearishness. Of the 3 INT tops, Jan 2018 and Mar 2020 saw sharp drops in the SKEW before the top, while the Dec 2018 drop saw a preceding drop in the SKEW.
A few weeks ago I showed the VIX term structure (VXV/VIX as ST/LT). The ST tops in 2019 occurred after 1.20 was reached, while INT tops saw clusters of readings over 1.2. The current period seems most similar to Nov-Dec 2019. Very similar to the SKEW, both the Jan 2018 and Mar 2020 tops were proceeded by sharp drops in the VIX TS and later for the Dec 2019 drop. The drop in the VTS prior to large declines has occurred when the LT VIX rose faster than the ST VXV, but that is not happening now.
Conclusions. All price targets have been met with last week's rally much stronger than expected. Sentiment is somewhat mixed at this point, indicating that a ST pullback of 3-6% may be expected at any time, but that an INT top may still be 2-3 months away.
Weekly Trade Alert. Some weakness may occur by the EOW. Updates
@mrktsignals.
© 2020 SentimentSignals.blogspot.com


Market issues in the tech sector are in parabolas. The Nasdaq & NDX are 4 deviations over there long term Bollinger bands.Yearly Quarterly Monthly only in 2000 did this happen. This kind of price action means sentiment values are moot.
ReplyDeleteThe market is clearly being held up in front of the election, but I don't see that last into November 3rd. I expect a late September or early October high, and the closer to the election the better for Trump. It's going down hard afterwards, regardless of who wins, but it should top beforehand as the "unknown winner" will have bulls nervous and they will want to cash out in advance. November and December (probably January too) will be a disaster I think. Non-stop selling. We'll see that 40% drop if Trump wins (I pray he does) or 99% if Biden wins.
ReplyDelete