Saturday, August 22, 2020

Only Two Pillars Remaining

Two weeks ago, I extended the sentiment chart period back to July 2017 to include the move from Aug 2017 (a volatility event) to the Jan 2018 high as an alternate "run to the top",  compared to the Oct 2018 and Feb 2020 tops which were preceded by 3% and 6% pullbacks only weeks before the final blow off.  Now it appears that price behavior is supporting the "alternate" with the June swoon providing the volatility event.  This is supported by sentiment as shown below as the two remaining "less bearish" sentiment indicators - the VXX $ volume, as too many hedgers are looking for a short but sharp decline, and the ETFs as measured by the 2X SPX and NDX ETFs.  Several weeks still appear to be remaining before the final two pillars fall.

Last week was somewhat stronger than expected as a move down to the SPX 3350 area indicated by the options OI was accomplished but then immediately reversed, mainly on the back of a 10% rise in AAPL late in the week in anticipation of the 4 for 1 stock split pricing on Mon 24th (likely $500+, split date 31st).  The SPX seemed to run into a brick barrier at the 3400 area several times during the week but options OI still indicates that a move to 3400-20 or higher is likely next week,

Late Sept remains as a target for a probable top and the extremes seen in sentiment are warning that the following decline could be more serious than Mar 2020, either in price or time or both.  For instance, a 40% decline in 3 to 6 months from SPX 3600 would target the 2160 area.


I. Sentiment Indicators

The overall Indicator Scoreboard (INT term, outlook two to four months) bearish sentiment has reached a lower level than any time the last three years where INT tops with lower levels semm to indicate increasingly larger declines.


The INT view of the Short Term Indicator (VXX $ volume and Smart Beta P/C [ETF Puts/Equity Calls], outlook two to four months) bearish sentiment has been following a pattern of lower lows and lower highs, but is currently held up by the volatility bulls.


Looking more closely at only the VXX $ Volume the bearish sentiment declined very sharply at the beginning of the rally off the Mar lows, but comparing current levels to the rally off the Dec 2918 lows, lower levels are expected before an INT top.


Bonds (TNX).  Bearish sentiment in bonds dropped slightly with the pullback in rates.


For the INT outlook with LT still negative, the gold miners (HUI) bearish sentiment retreated from its recent spike as both gold and the miners rallied strongly to start the week on news that W. Buffet had purchased a $500+M stake in Barrick Gold, then closed the week near even.


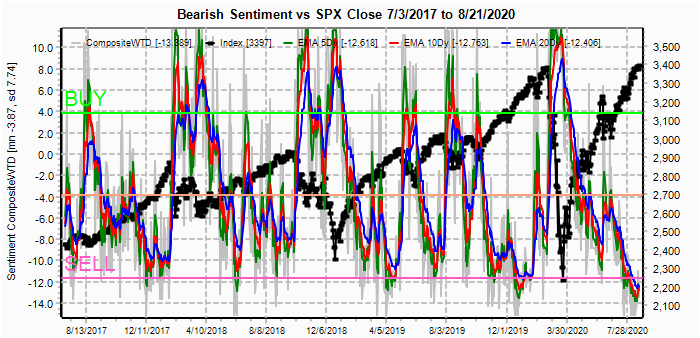
II. Dumb Money/Smart Money Indicators

The option-based Dumb Money/Smart Money Indicator as short/INT term (outlook 2 to 4 mns/weeks) bearish sentiment continues to make new lows, especially with the LT EMA (blue) well below that of Jan 2020, indicating a more serious decline (lower/longer) is likely.


And the sister options Hedge Ratio sentiment is almost in an identical position, indicating almost a complete lack of hedging.


The INT term SPX Long Term (2x/DM) ETFs (outlook two to four weeks) bearish sentiment has been a holdout until recently, but LT EMAs are nearing the danger level of 0.3 (30% S/L).


The INT term NDX Long Term (2x/DM) ETFs (outlook two to four weeks) bearish sentiment has finally broken below neutral (.66).  At this time, it seems that alternation is likely so a level of about .50 similar to Sept-Oct 2018 is the target.  This may correspond to 12k to 12.5k on the NDX.  A 40% decline to about 7.5K could test the lower TL.


III. Options Open Interest

Using Thur closing OI, remember that further out time frames are more likely to change over time, and that closing prices are more likely to be effected. Delta hedging may occur as reinforcement, negative when put support is broken or positive when call resistance is exceeded.  This week I will look out thru Aug 31. Also, this week includes a look at the GDX for Sept exp. 

With Fri close at SPX 3397, options OI for Mon has relatively small OI, except at 3475, put support is at 3350 while call resistance over 3400 may cause backing and filling to 3375.  The calls at 3475 were $.05 Fri aft with someone possibly expecting a stimulus compromise over the WE.  A gap up of 30-50 pts would probably cause a 5x to 10x return.


Wed is also light where SPX put support has now dropped to 3335 with little call resistance until 3425 with a major inflection point at 3375.  There may be some volatility during the end of the GOP convention, but it could go either way.
 

For Fri, larger OI shows the range bound area seen last week as likely with put support beginning at 3380 and call resistance at 3400.  So any move over 3400 by Wed/Thu is likely to be reversed.
 

For the EOM Mon 31st, SPX OI currently shows a more bearish bent with call resistance down to 3350, but more puts are likely to be rolled over during the week.  Strong call resistance at 3450 is likely to contain any breakout.


Using the NDX ETF QQQ (NDX/41) for Fri closing at 281.9 (11,555), the QQQ has blown past call resistance shown last week as it jumped up from 272.  The small call positions offer little resistance, while major support is at 270.


Using the GDX as a gold miner proxy closing at 40.89 and was stronger than expected with the Barrick Gold news peaking over 44 before falling back toward call resistance at 40.  Sept opt exp is much the same as Aug where strong resistance is at 40 and above.  Price below 40 is expected.


Currently the TLT is 166.2 with the TNX at 0.64% and last weeks put support was expect to give a positive bias from 163.2.  


IV. Technical / Other

This week I will look at an update of two of the Equity P/C data mining sentiment indicators.  The first is the Equity P/C to SKEW spread which has been following an expandomg wedge since mid-2017 where  bearish sentiment leads to larger and higher bearish sentiment leads to larger rallies.  If it continues, a decline of 40% or more seems likely.


The second is the volume of the equity calls (speculation) and puts (hedging) as low Equity P/C with low put buying is usually smart money longs, but a rise in put buying is smart monry hedging.  Both Dec 2017 and Sept 2018 saw put buying reach 800k 10 day SMA about a month before the INT top, while Jan-Feb 2020 saw 850k.  Now at 750k, a top is likely several weeks away.


Conclusions.  For several months now, I have been looking at the Fall as a high risk area and sentiment is now showing that at least an INT top is near.  What will the reason be to cause a sharp decline?  It's hard to tell.  Late last year I indicated that a 30% plus correction was likely, but did not foresee the devastating effect that Covid-19 would have on the economy.  Low bearish sentiment is somewhat like the dry tinder brush in the CA hills after several months of dry weather over the summer, all it takes is a spark, or for this year lightning strikes.

Given the pattern of increasing wild swings in sentiment followed by wild swings in stock prices seen since late 2017, a larger decline than Mar 2020, perhaps 40% to test/best the Mar lows followed by an even stronger rally to SPX 4000+ seems likely LT.  Tech stocks have been seen as the only safe haven as more businesses have adopted the "work from home" outlook and should continue to outperform to the upside INT.

Extremely low bearish sentiment is suppressing upside potential for the SPX, so a top should be limited to somewhere around 3500 and the the dominant effect for the next several weeks could be volatility compression.

Weekly Trade Alert.  SPX 3400-20 seems likely next week, but likely to reverse by EOM.  Updates @mrktsignals.

Investment DiaryIndicator Primer,
 update 2020.02.07 Data Mining Indicators,
 update 2019.04.27 Stock Buybacks,
 update 2018.03.28 Dumb Money/Smart Money Indicators

Article Index 2019 by Topic, completed thru EOY 2020.02.04
Article Index 2018 by Topic
Article Index 2017 by Topic
Article Index 2016 by Topic

Long term forecasts

© 2020 SentimentSignals.blogspot.com

No comments:

Post a Comment